The Lifted Index and K Index—Indicators of Instability in the Atmosphere
These two indexes tell meteorologists the potential for convection and severe weather.


The Lifted Index is one of many used by meteorologists to give an indication of atmospheric instability and the potential for convection that might lead to severe weather. The Lifted Index is a value obtained by computing the temperature that a parcel of air near the ground would have if it were lifted at the adiabatic lapse rate (dry adiabatic lapse rate to saturation, then via the moist adiabatic lapse rate) to a higher level, generally 18,000 feet (approximately the 500mb level), and then comparing that temperature to the actual temperature at that level.
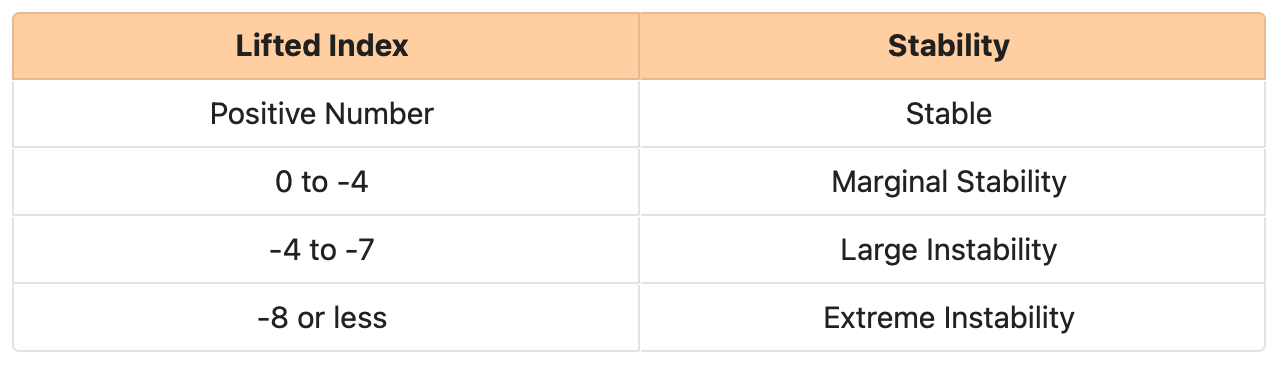
Atmospheric temperature generally decreases with height. A parcel of air that rises from the surface cools as it does so, usually at a slower rate, meaning that it remains warmer than the surrounding atmosphere until it reaches its equilibrium level, at which point its temperature matches its surroundings and the parcel stops rising. After subtracting the surface temperature from the computed temperature at the 500mb level, a negative result is an indication of instability; the air is warmer than its surroundings and more buoyant. The table below gives some relative values:
One of the downsides of the Lifted Index is that it measures only the lower part of the troposphere. It is a sounding variable, a single value at each location and does not change from one level to another. Thus, a negative LI value indicates the planetary boundary layer (PBL) is unstable compared to higher altitudes. Since the PBL is where initial convection is generated, this LI value may be an indicator of convective potential. CAPE, on the other hand, measures convective potential throughout the troposphere and is usually considered more useful. Keep in mind that neither CAPE or Lifted Index is a magic indicator of the potential for thunderstorms or severe whether. With regard to LI, there are no threshold values below which severe weather becomes imminent. LI is also influenced by diurnal temperature changes, becoming more negative during daytime heating and more positive during nighttime cooling.
 Keith R Thompson, WeatherHawks
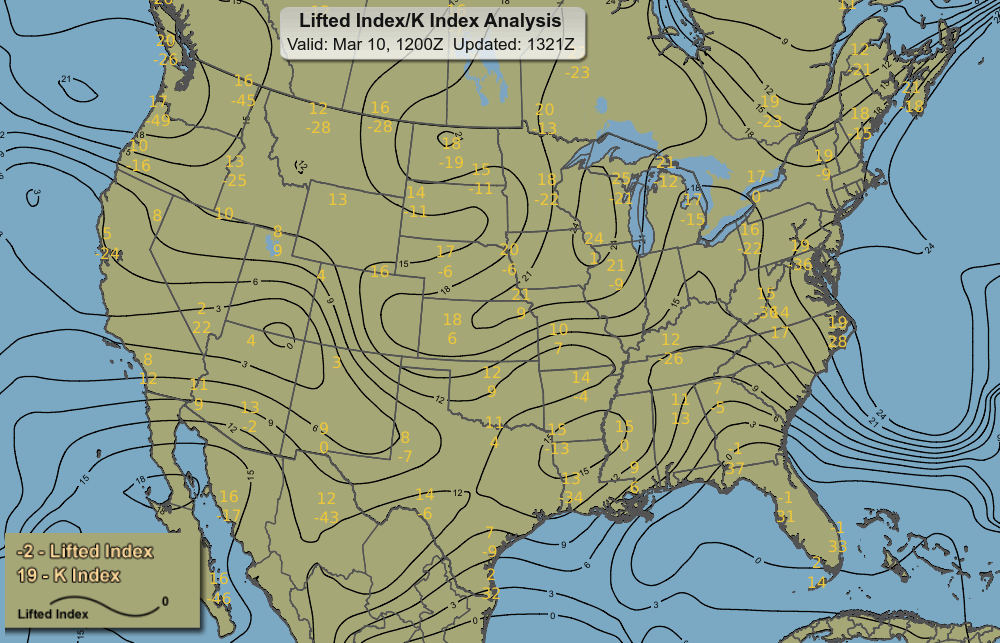
 Keith R Thompson, WeatherHawks
Since they cannot measure the temperature directly, meteorologists can calculate the LI using computers, but can also easily calculate it on a Skew-T chart. The limitation of LI is that it relies on only three sounding inputs—temperature and dew point of the PBL and the temperature at 500mb. This may miss atmospheric features such as inversions or dry layers. Vertical wind shear is another factor in severe weather formation that is not accounted for by the Lifted Index.
Finally, Lifted Index is primarily for use during warm weather convection. LI is of little use or worthless when a shallow polar air mass moves into the PBL and is equally worthless in forecasting winter precipitation.
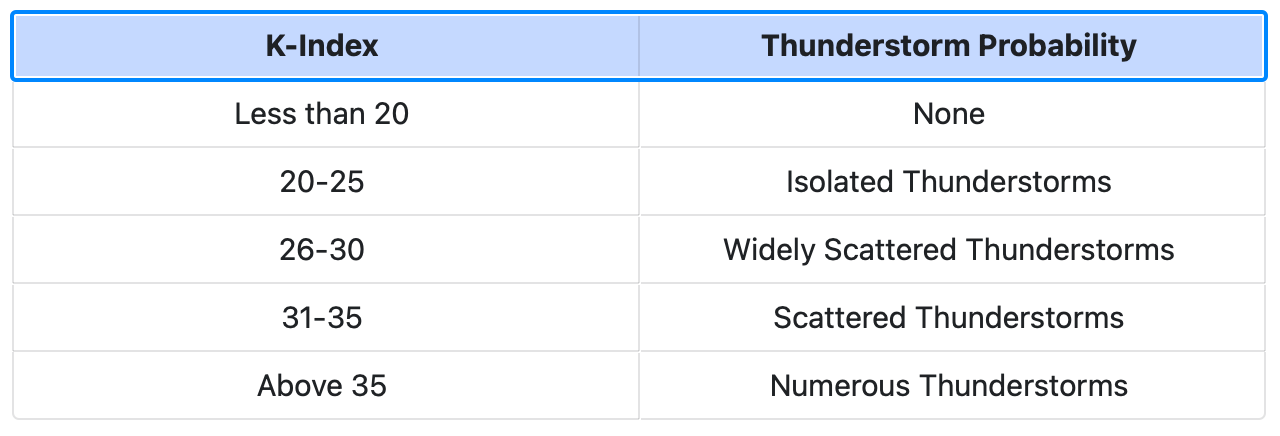
K Index
An adjunct to the Lifted index is the K Index. The K Index is primarily of interest to meteorologists and is applicable in the prediction of air mass thunderstorms. K Index is frequently plotted on the same chart with LI (See Fig. 2, above). A low K Index value in the presence of other strong thunderstorm factors, such as a sharp trough or a high-level jet, may indicate a potential for severe thunderstorms. The K Index is a measure of thunderstorm potential, but not of severity. The index also cannot be used in mountain areas and may not be representative of the airmass if the 850mb level is near the surface.
The table below gives some representative K-Index values and the corresponding potential for thunderstorms: