Precipitable Water
Precipitable water is gaining greater importance in climate change research and meteorology.

Even though it’s not always apparent, the atmosphere contains an enormous amount of water that is constantly being circulated by convection and winds. This water gives us rain, snow, clouds, and thunderstorms and the amount of water available in a particular part of the atmosphere can have an important bearing on the weather being experienced.
Also known as Total Precipitable Water (TPW), or sometimes PWAT, this is the amount of water that can be extracted from a column in the atmosphere extending from ground level to, generally, 300 millibars, or about 30,000 feet. At atmospheric scale, it’s a pinpoint measure of available moisture. TPW assumes a unit cross section of the column and calculates the depth of the water if all the moisture within that column were converted to a liquid state, measured in millimeters or inches.
A column of air can actually precipitate out more than the amount of measured precipitable water due to convergence of moist air from outside the column. Rainfall is not instantaneous, falling over a period of time and over a larger area. Nevertheless, TPW is a useful measure of the moisture content of an atmospheric sample at a given point in time and space. Precipitable water can also reveal the presence of atmospheric rivers, which have a huge effect on our west coast weather.
 Keith R Thompson, WeatherHawks
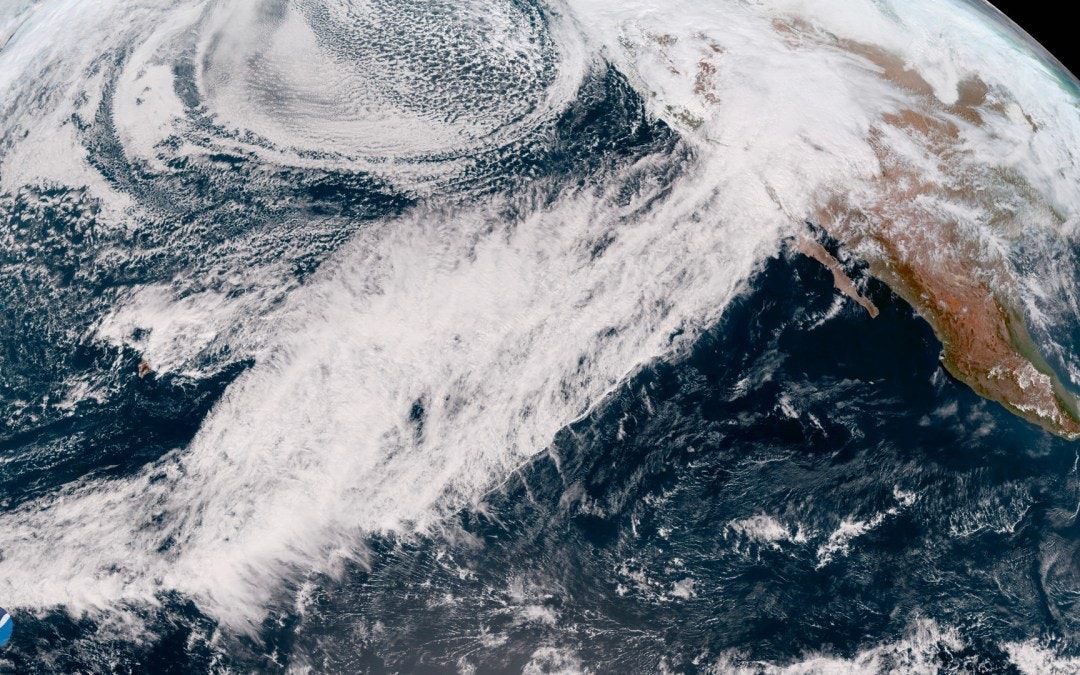
Measuring the amount of moisture in the atmosphere is important, since water vapor has so much influence on our climate. Most people don’t think of it as such, but water vapor is a greenhouse gas. It affects the temperature of the earth just as other greenhouse gasses such as carbon dioxide. This is because of several factors.
The atmosphere is transparent to visible light, allowing short wave radiation to pass through relatively unimpeded. Only a segment of the blue frequencies is scattered and reflected, giving the sky its characteristic blue color. As the arriving energy from the sun heats the earth, some of it is re-emitted from the ground in the long wave portion of the spectrum. Because water vapor will absorb much of this long wave energy, slowing its radiation back into space, the water vapor acts as a heat barrier, trapping the heat in the lower part of the atmosphere. Normally, the high radiative cooling at night, along with other factors, acts to balance out this warming, preventing runaway heating of the atmosphere. As the climate warms, the air will begin holding more moisture, a roughly 7% increase for every 1°C.
Higher moisture content in the atmosphere tends to dampen updrafts, since the updraft is countered by the gravitional pull on the precipitation. A reduction in updraft velocity also tends to reduce hail size. Moisture contents below 1.25 inches of TPW are considered low to moderate. TPW of 1.25 inches to 2.0 inches are considered high moisture content and values above 2.0 inches are rated as very high. High TPW can affect whether a storm develops as a supercell and can portend higher lightning amounts.
Scientists are beginning to pay more attention to precipitable water because as TPW increases so does the greenhouse effect. Even as some areas experience increasing dryness due to climate change, other areas may suffer from higher rainfall, with the associated effects of flooding, crop damage, and higher humidity.
There are several methods of measuring precipitable water, such as data from radiosonde soundings, GPS methodologies, and satellite microwave sensors, plus more complex methods that are beyond the scope of this article.
The atmosphere is divided into dry and moist regions. The dry region is considered to be the atmosphere above 8-10 kilometers. The moist region is below 8 km. The dry atmosphere is modeled to a high degree of accuracy; the moist region much less so, which is the primary challenge to climate scientists and meteorologists.
Radiosonde soundings from weather balloons have the advantage of providing a direct sample of a vertical slice of the atmosphere, but suffer from the fact that many states may have only one or two Weather Service offices that have balloon launch capability. The resulting data lacks resolution because the soundings are so far apart and models must extrapolate for large areas without soundings.
Satellite sensors are currently the favored method of measuring atmospheric water vapor. Water vapor, due to the vibration of water molecules, emits energy in the microwave band, which can be measured by sensitive sensors on satellites.
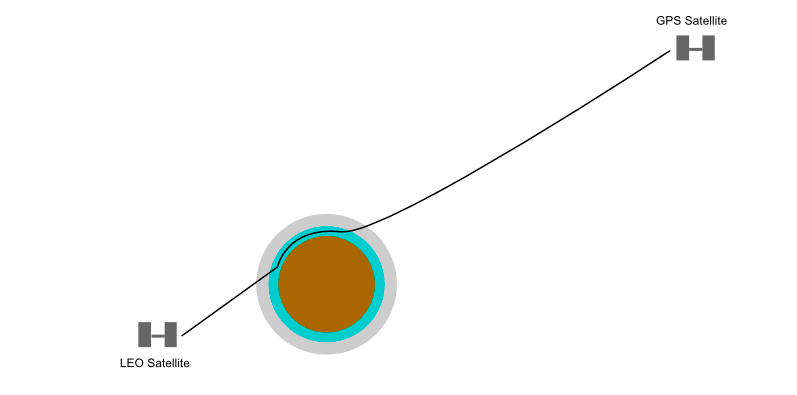
Another technique is to measure the refraction of GPS signals as they pass through the atmosphere from a low earth orbit (LEO) satellite to a GPS satellite on the other side. The atmosphere acts as a spherical lens, bending the GPS signal as it passes through (Fig. 2). The dry portion of the atmosphere, as mentioned, is accurately modeled, but the lower moist region is less so, which means GPS measurements of atmospheric moisture must be supplemented by other observations. Solutions for density, temperature and water vapor cannot be resolved by GPS data alone. Since the position of the two satellites is well known, it is possible to calculate the degree to which the signal is refracted, or bent, slowing the propagation of the signal. This refraction is affected by the amount of moisture in the lower atmosphere, but at a relatively low resolution. Currently, the GPS/MET receiver aboard the MicroLab-1 satellite is functioning as a proof-of-concept that this is both effective and economical, according to the University of Texas, Austin.
Data from weather balloons and satellites is then fed into weather models, which extrapolate the TPW readings over a wider area, giving meteorologists a fairly good idea of how much moisture is available in the atmosphere for potential precipitation.
Measurements of precipitable water prior to around 1990 were primarily from weather balloon soundings. For this reason, TPW measurements are of greater use to meteorologists than to climate scientists. This will change in the future as the more accurate satellite measurements enlarge the dataset and give climate scientists a longer timeline in which to observe trends.
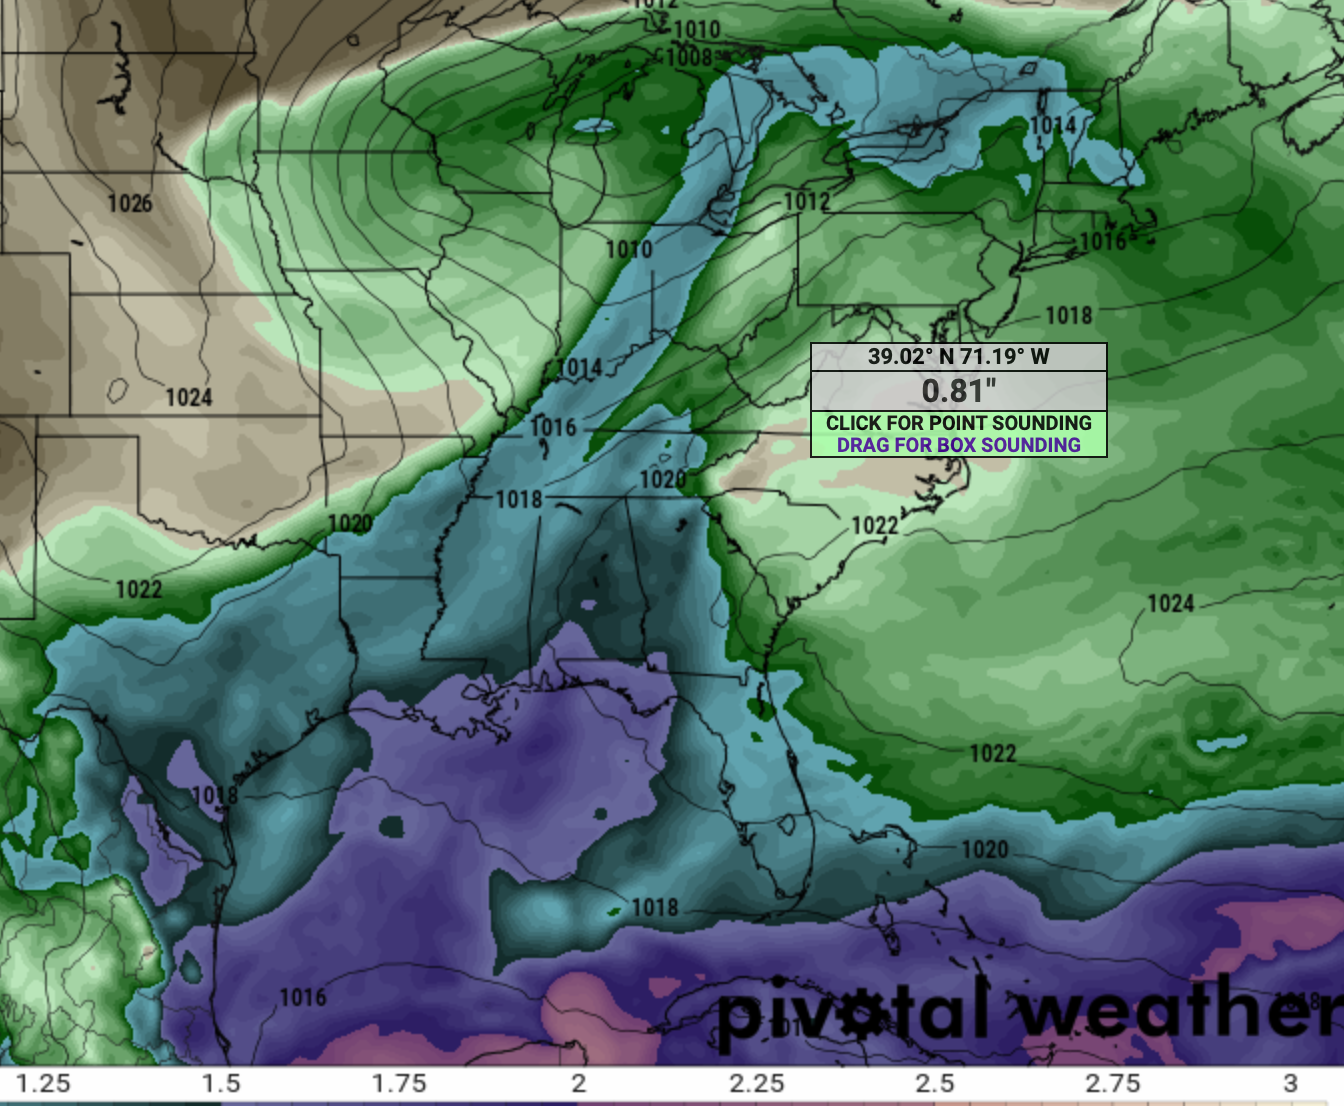
There are several sources for precipitable water publicly available to interested observers. One excellent source is Pivotal Weather (subscription), which offers interactive maps of TPW (Fig. 1, above).
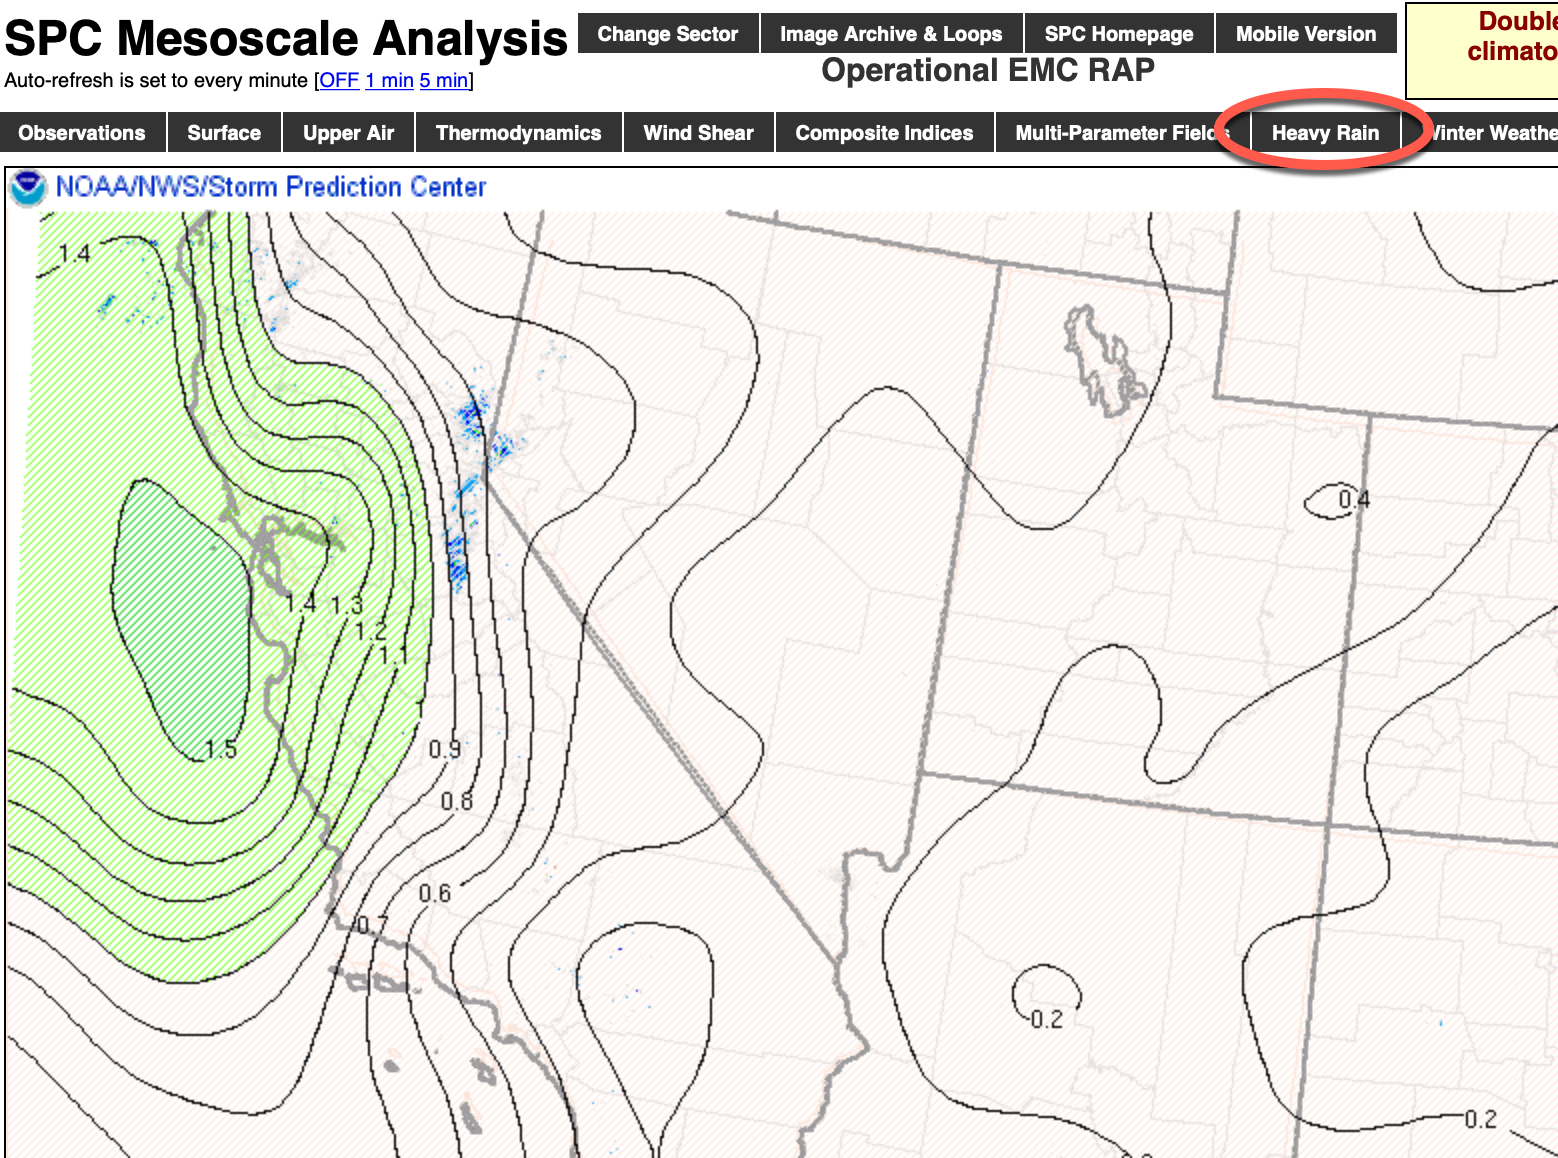
The Storm Prediction Center’s Mesoscale Analysis website also has maps showing values for TPW. Look under the Heavy Rain tab (Fig. 3).
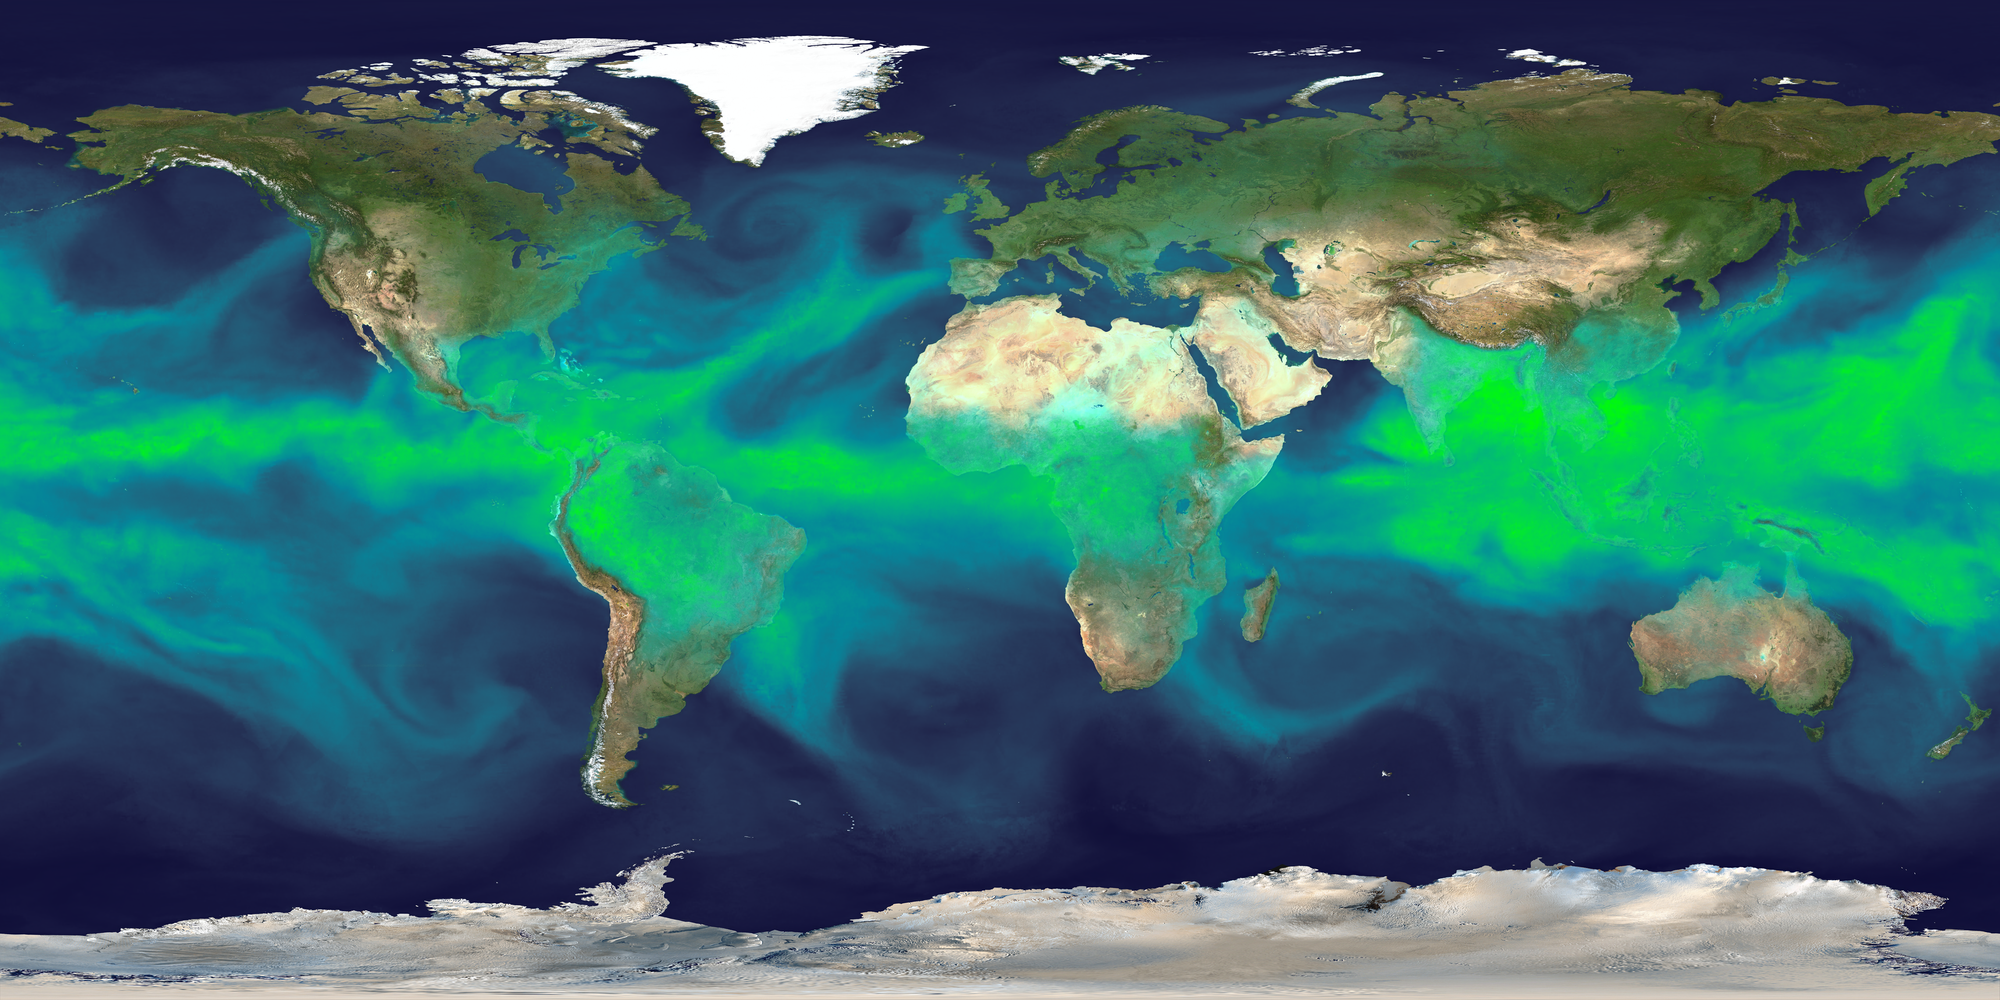
The Advected Layered Precipitable Water website shows an animated 36-hour loop of moisture moving around the globe. Likewise, NOAA's Office of Satellite and Product Operations (OSPO) has an animated map of Operational Blended TPW Products available here.
Finally, you can see a satellite view of water vapor imagery over CONUS at NOAA's NESDIS site.
If you read your local NWS Weather Forecast Office’s forecast discussion, you are likely to see mention of precipitable water, especially when thunderstorms or significant precipitation is possible. It is one indicator of the amount of water available, but is not in and of itself a predictor of precipitation or precipitation amounts. Nevertheless, just as meteorologists are now doing, paying attention to the amount of available moisture in the atmosphere can provide clues to the potential for significant rainfall.