Theta‑e
Theta‑e sounds complicated, but can give observers a hint as to atmospheric stability.


There are many factors that go into production of our weather forecasts—CAPE, warm and cold air advection, orographic lift, upslope, drylines, and weather fronts. All exert their influence on our dynamic atmosphere and must be taken into account by meteorologists when formulating our forecasts.
One factor that is overlooked by many observers (but not meteorologists) is Theta‑e, or Θe. Theta‑e is measured in degrees Kelvin (°K). Theta‑e is also known as Equivalent Potential Temperature. By definition, it is the temperature a parcel of air would have if:
it was lifted until it became saturated;
all water vapor was condensed out; and
it was returned adiabatically (i.e., without transfer of heat or mass) to a pressure of 1000 millibars.
The significance of Theta‑e is the higher the value (°K) the more unstable the atmosphere. It is directly related to the amount of heat in the atmosphere and is thus an indicator of stability or instability. Higher Theta‑e values indicate a greater chance for positive buoyancy, which is necessary for convection.
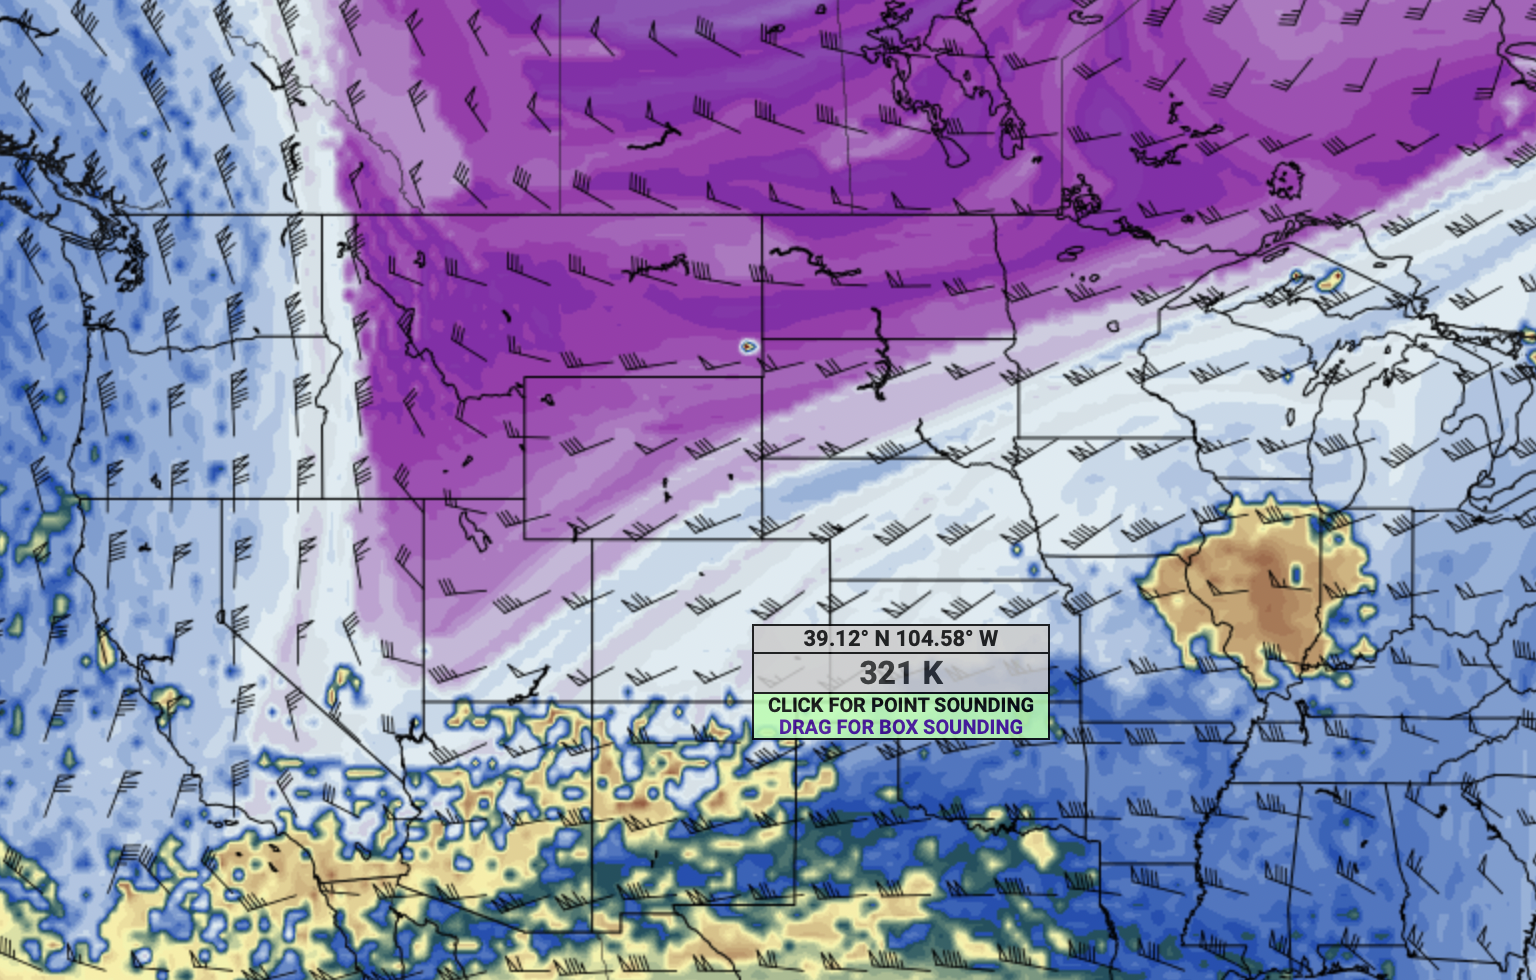
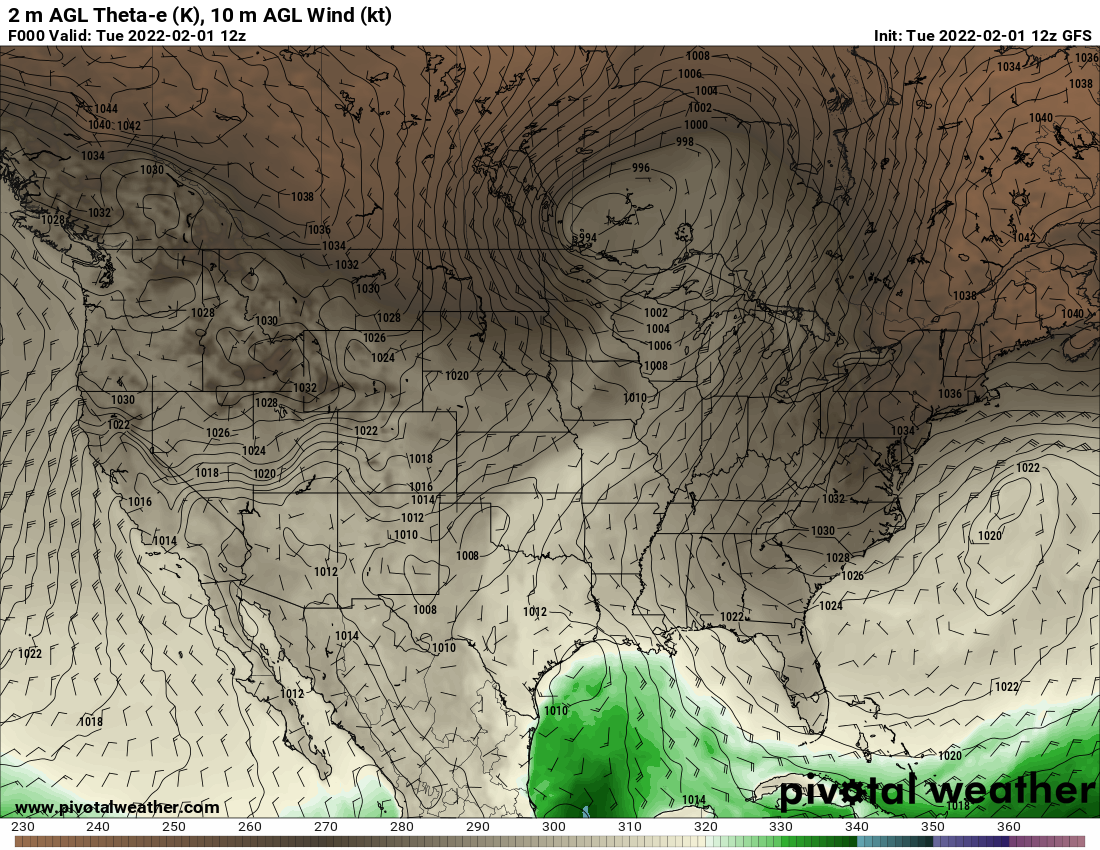
The map above from Pivotal Weather shows forecast wind barbs and Theta‑e values for the period Wednesday, February 2, 2022, as calculated by the GFS (Global Forecast System) weather model. The period was forecast to see a major winter snowstorm throughout Colorado. The sample shown here is 321K, which is a high enough number to indicate atmospheric instability at that location for the valid period.
Another feature of Theta‑e is the Theta‑e ridge, an axis of high Theta‑e values. Severe weather and excessive rainfall often occur near or just upstream from a Theta‑e ridge. Regardless of the value of Theta‑e, storms will not occur if strong capping is in place. Capping is a layer of warmer air overlaying the lower atmosphere and acting as an inversion.
Warmer temperatures and higher dew points will increase Theta‑e and can point to greater instability and a greater chance of convective activity. Likewise, a low-level jet of moist air can also fuel higher Theta‑e values and greater instability.
How can I find Theta‑e?
Most online weather services include Theta‑e in their data. The National Weather Service’s Mesoscale Analysis Pages includes Theta‑e plots under the “Surface” tab. Pivotal Weather also has Theta‑e maps under their “Surface and Precipitation” and “Upper Air:Dynamics” tabs. Pretty much any of the subscription weather services offer Theta‑e plots.