The NOAA Central Library: A Treasure Trove for Weather and Climate Researchers
Researchers, observers, and teachers will find the NOAA Central Library collections a valuable resource.

If you’re a climate or weather researcher, or just curious what the weather was on a particular date in the past, the collections available in the NOAA Central Library should be your first stop. From archival and current photos, rare books, research papers, and historical weather maps, it's a great place to start your research or just casually browse.
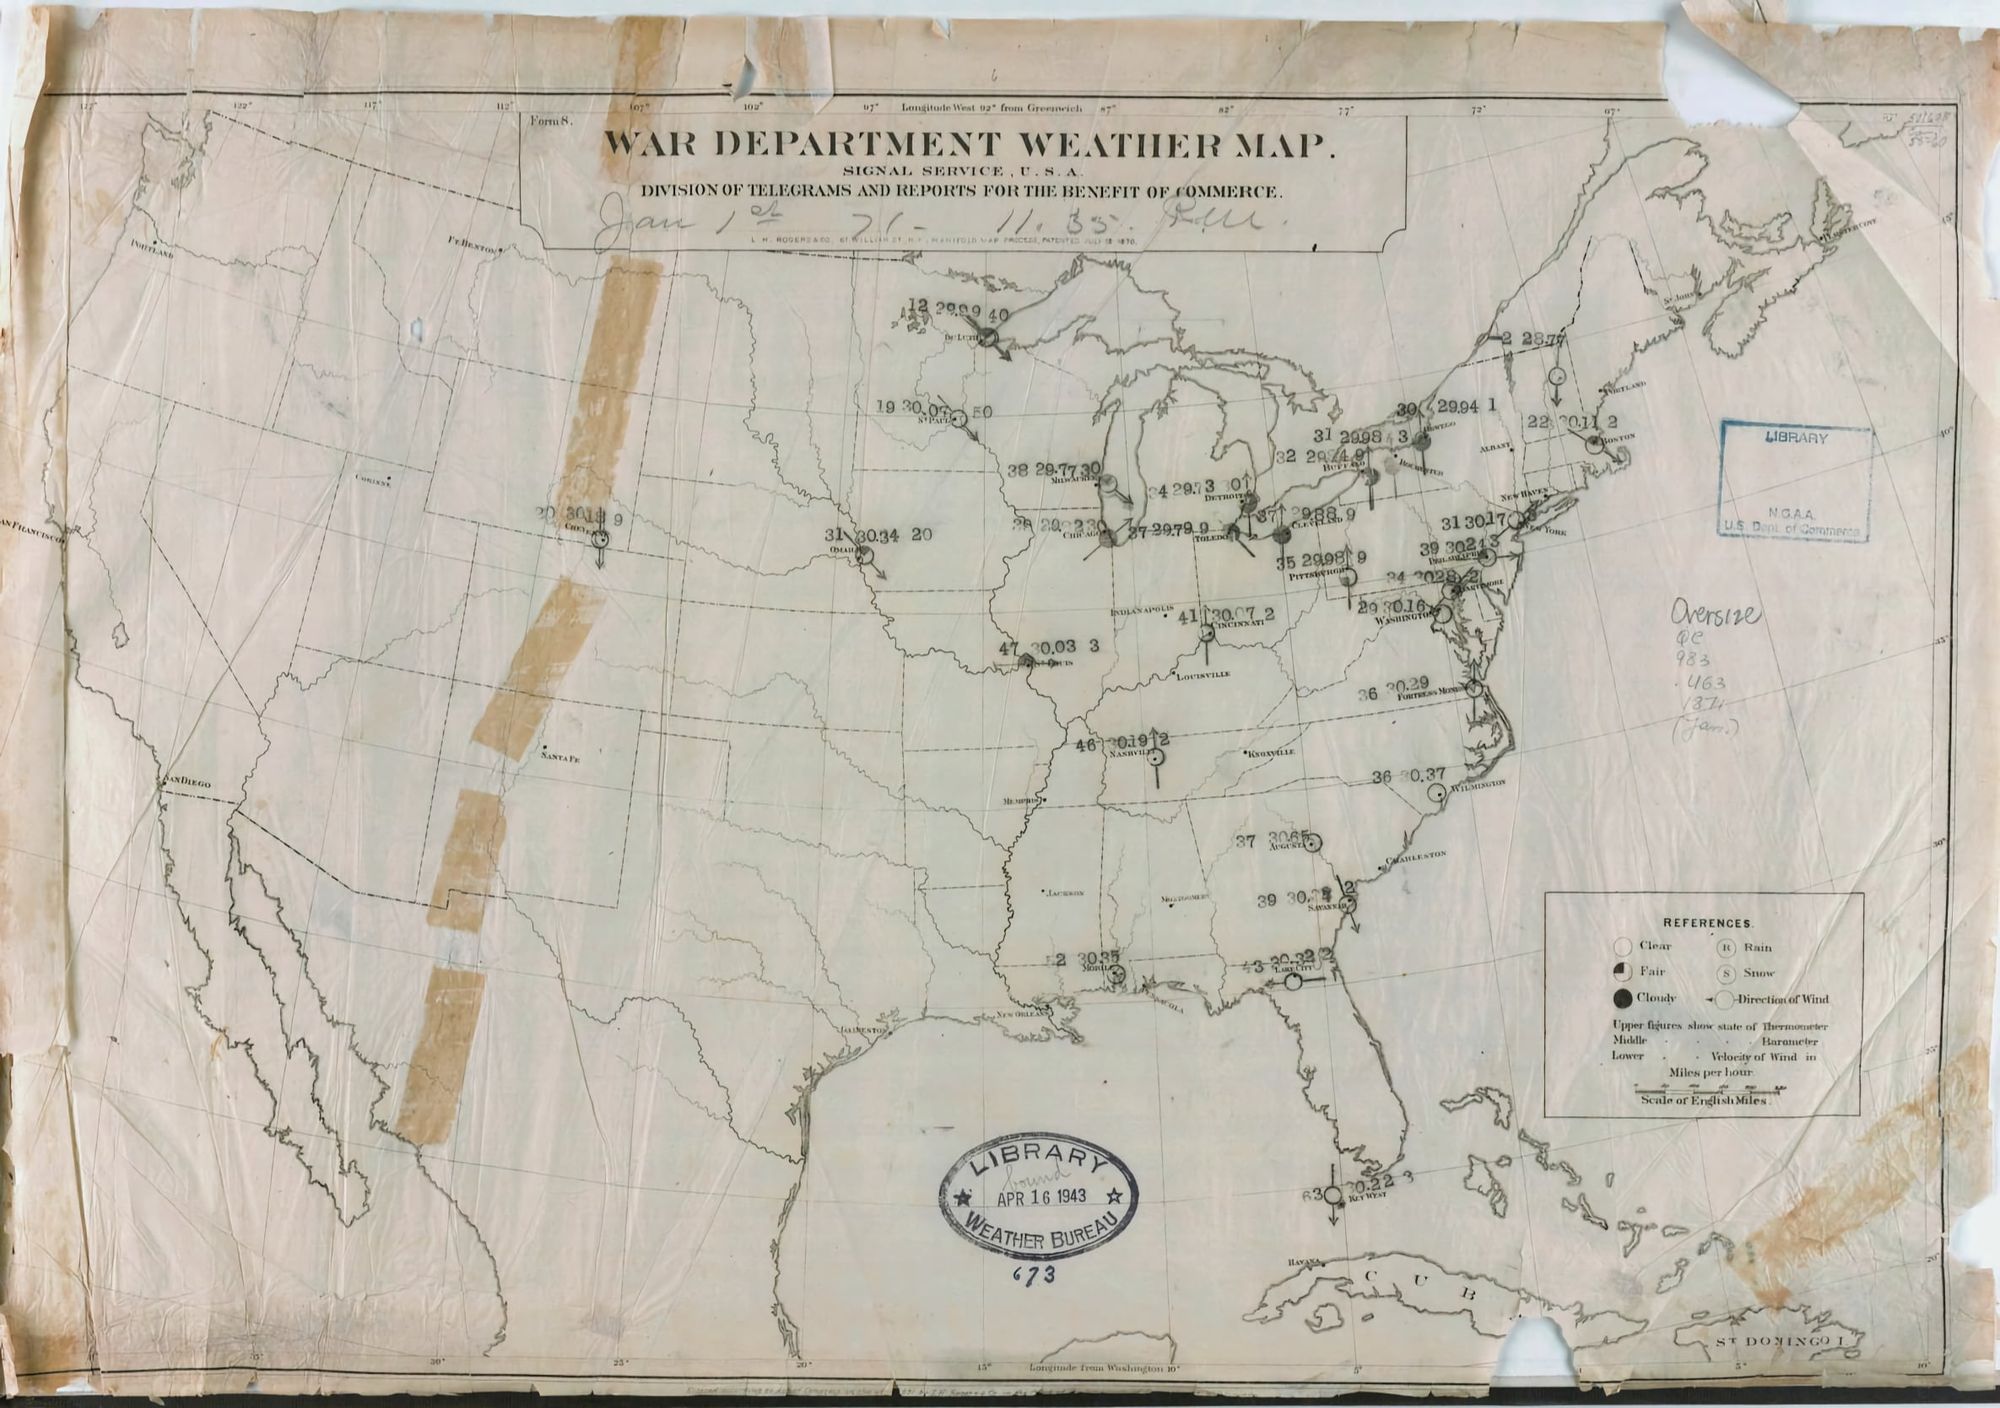
US Daily Weather Maps
The Central Library can display weather maps beginning with the first one published on January 1, 1871 (above), to the present. The maps are available in two formats, Djvu (pronounced Déjà vu) and PDF. The PDF files can be larger than Djvu files, but are generally easier to handle on most computer platforms. I use an Apple MacBook and found the Djvu plug-in wouldn’t load or work properly. I have not tried it on my Windows PC.
History of the Daily Weather Map
From the NOAA Central Library Website:
The U.S. Signal Office began publishing weather maps as the War Department Maps on Jan. 1, 1871. When the meteorological activities of the Signal Corps were transferred to the newly-created Weather Bureau in 1891, the title of the weather map changed to the Department of Agriculture Weather Map. In 1913, the title became simply Daily Weather Map. In 1969, the Weather Bureau began publishing a weekly compilation of daily maps with the title Daily Weather Maps (Weekly series).
The earliest weather maps featured only a map of the continental U.S. with the day's air temperature, barometric pressure, wind velocity and direction, and a general indication of the weather for various cities around the country plotted directly on the map.
Within a short time the Signal Office added a table showing the change in barometric pressure during the most recent 8 hours, the temperature change within the most recent 24 hours, relative humidity, and total precipitation within the most recent 24 hours. The Signal Office also added a general discussion of synoptic weather features and forecast, and then isobars and isotherms, on the maps. By the end of 1872 the map had acquired the format it would use for the rest of its run.
The daily weather maps for the period January 1 - August 6, 1914, also include a Northern Hemisphere map with data table.
Other collections available
- National Weather Service Heritage website—weather events, scientific and technological advancements, and personal accounts that comprise the last 150 years of the agency’s history.
- NOAA Photo Library—80,000 images showing NOAA’s work, archival weather satellite illustrations, and a link to NOAA’s Flickr account;
- Rare and Archival Material—a collection of rare 19th Century Oceanography books, works by prominent historical authors such as Euclid, Johannes Kepler, Ptolemy, and more.
- Weather and Climate—daily synoptic weather maps; foreign climate data; George Washington Carver and Tuskegee weather data; hurricane reports; monthly weather review; report of the Chief of the Weather Bureau; US Weather Bureau circular letters; US Army Signal Corps/Weather Bureau Annual Reports; Weather Bureau topics and personnel; weather modification project reports.
The NOAA Central Library is an invaluable resource and fun to explore for casual observers, meteorology students, historians, and teachers.