The Atmosphere
Our atmosphere's composition, and the chaotic changes in pressure and temperature, drive our weather systems.


Part 1—Under the Pressure
Introduction
Atmospheric pressure is one of the weather's most dynamic systems. It determines when and where the wind blows and how hard. It can drive clear sunny weather, or stormy, rain-drenched days. It determines aircraft performance and how well we breathe. The atmosphere and the oceans are Earth’s most chaotic and active systems, both interacting with each other, fighting with each other, and supplementing each other.
Our weather is heavily influenced by atmospheric pressure, or more accurately differences in pressure. Wind is a function of air moving from areas of high pressure to low pressure. Wind speed is driven by the pressure difference. Deep lows, such as tornadoes and hurricanes, generate very intense, localized, highly destructive winds.
The atmosphere is always trying to achieve balance. Any difference in pressure between two locations results in air movement as balance is attempted. The effort is futile, of course. Heating and cooling of the earth’s surface differs greatly, depending on the terrain, albedo, cloud cover, and tree cover. The amount of moisture in the air is dependent on the presence of large and small bodies of water. All of these millions of variables keep the atmosphere active and constantly shifting.
Most people don't think of air as having weight, but in reality it does and that weight affects everything from high- and low-pressure systems to wind, aircraft performance, ocean-atmosphere interactions, and respiration. If air weighs so little, how does it assert so much pressure?
What is air made of?
Air consists of molecules of oxygen (21%), nitrogen (78%), argon and other trace gases (1%), and water vapor. Water vapor is not included in dry air percentages because it varies so dramatically with temperature and location. In cold, dry arctic air it can be as low as 0%, while in warm, humid tropical air it can range from 1-4%.
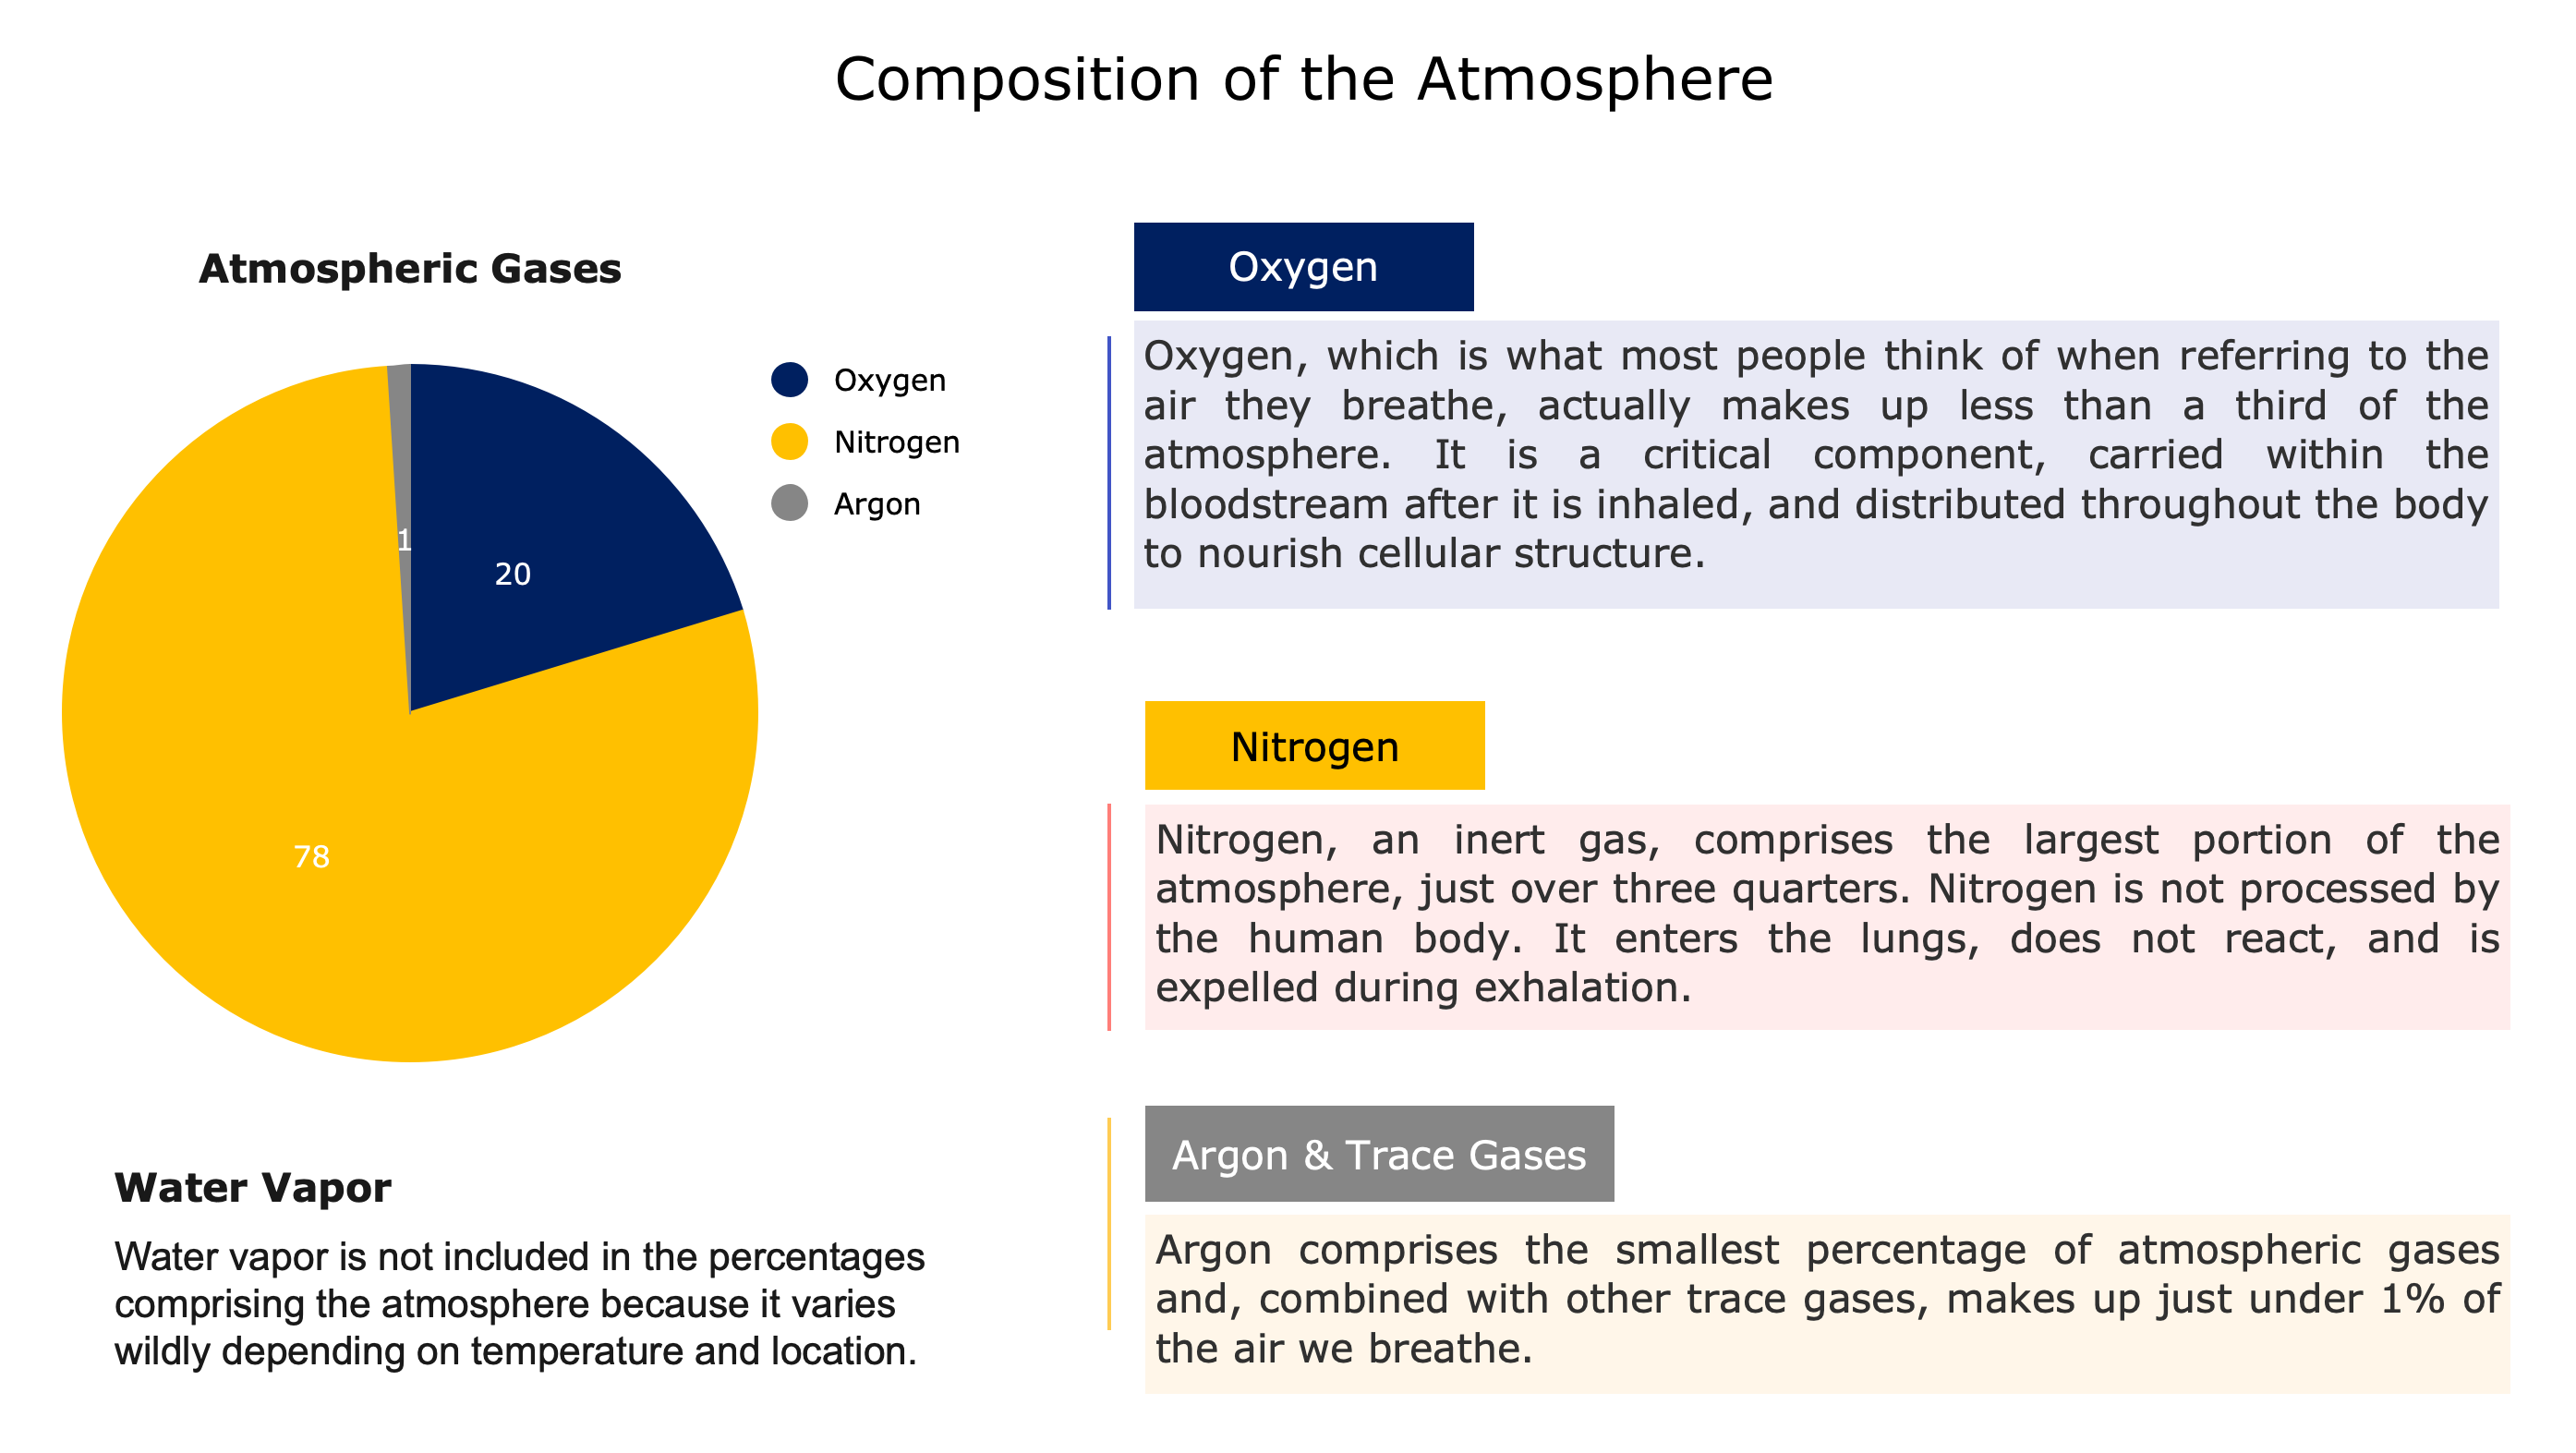
Why does Nitrogen make up such a large proportion of our atmosphere? Nitrogen is non-reactive, or inert. It coexists with oxygen, water vapor and trace gases without doing much of anything. Humans can’t metabolize Nitrogen, so it is inhaled and exhaled unchanged. Over time, Nitrogen has simply accumulated in the atmosphere.
Trace Gases
Trace gases are by definition present in tiny amounts in the atmosphere. This does not mean, however, that they aren’t important or do not have an outsized influence on our environment.
Most Abundant Trace Gases (by volume)
|
Gas |
Typical Mixing Ratio |
Notes |
|
Water vapor (H₂O) |
0–4% (highly variable) |
Varies by weather & location |
|
Carbon dioxide (CO₂) |
~420 ppm |
Well-mixed, rising due to human activity |
|
Neon (Ne) |
18.2 ppm |
Noble gas, inert |
|
Helium (He) |
5.24 ppm |
Light noble gas |
|
Methane (CH₄) |
~1.9 ppm |
Strong greenhouse gas |
|
Krypton (Kr) |
1.14 ppm |
Noble gas |
|
Hydrogen (H₂) |
0.55 ppm |
From photochemistry & biology |
|
Nitrous oxide (N₂O) |
0.335 ppm |
Ozone-destroying in stratosphere |
|
Xenon (Xe) |
0.087 ppm |
Noble gas |
|
Ozone (O₃) |
0–0.1 ppm (locally higher) |
Protective in stratosphere, pollutant near surface |
(ppm = parts per million by volume)
Important Ultra-Trace Gases
|
Gas |
Typical Amount |
|
Carbon monoxide (CO) |
~0.05–0.15 ppm |
|
Nitrogen dioxide (NO₂) |
<0.01 ppm (background) |
|
Sulfur dioxide (SO₂) |
<0.01 ppm (background) |
|
Ammonia (NH₃) |
~0.001–0.01 ppm |
|
Nitric oxide (NO) |
~0.0001–0.001 ppm |
|
Hydrogen sulfide (H₂S) |
~0.0001 ppm |
|
Chlorofluorocarbons (CFCs) |
parts per trillion (ppt) |
|
Hydrofluorocarbons (HFCs) |
ppt |
|
Perfluorocarbons (PFCs) |
ppt |
|
Sulfur hexafluoride (SF₆) |
~10 ppt |
(ppt = parts per trillion by volume)
Trace gases collectively make up less than 1% of the atmosphere (excluding variable water vapor). While some are chemically inert (Ne, He, Kr, Xe), others strongly affect climate and chemistry. Some are classified as greenhouse gasses (H₂O, CO₂, CH₄, N₂O, O₃), while others affect air quality and health (O₃, CO, NO₂, SO₂, NH₃). Then, there are ozone-depleting or climate forcing industrial gases (CFCs, HFCs, SF₆). Even at parts-per-billion or parts-per-trillion, many have major environmental impact.
Aerosols
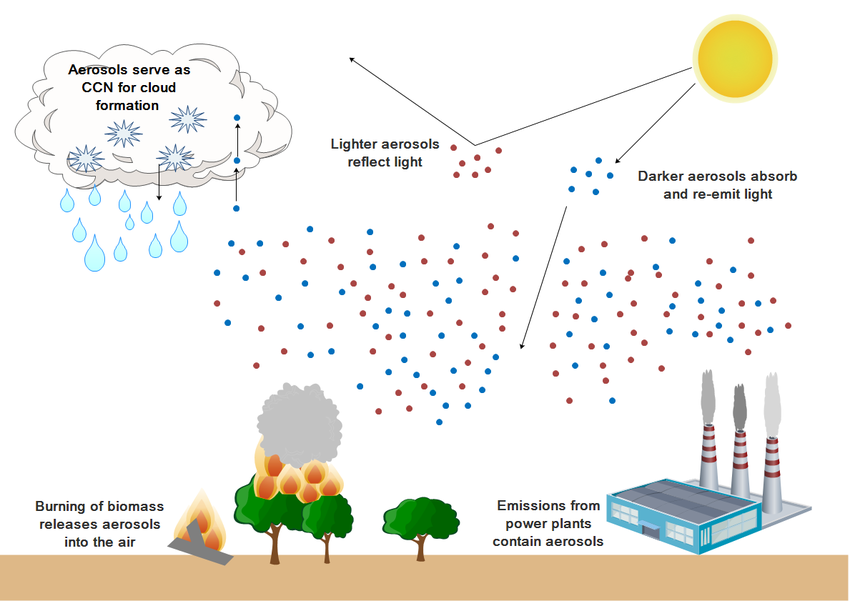
Aerosols are microscopic solid or liquid particles suspended in the air, ranging from a few nanometers to several micrometers in size. Common aerosols include dust and sand, sea salt from evaporating sea spray, smoke and soot (black carbon), sulfates and nitrates, pollen, spores, and microbes. These aerosols can arise naturally from volcanoes, oceans, deserts, or wildfires, or can be anthropogenic from combustion, industry, or agriculture.
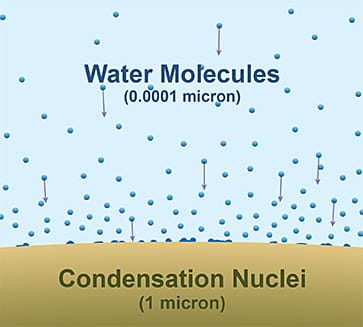
Aerosols’ most important roles are as cloud condensation nuclei (CCN) and ice-nucleating particles (INPs). Simply put, water and ice cling to aerosols in the atmosphere, enhancing formation of raindrops, clouds, and ice crystals or snow. In the absence of aerosols, water vapor would need unrealistically high supersaturation to condense. CCN allow cloud droplets to form at typical atmospheric humidities. The number and type of aerosols influence cloud droplet size, cloud brightness (albedo), and precipitation efficiency. Aerosols can alter rainfall patterns, especially in convective clouds. Clean air has fewer CCN, which means larger droplets, so rain forms more easily. In polluted air, many CCN are present, meaning many small droplets that may suppress or delay rain. This is because it takes longer for small droplets to collide and coalesce into larger drops that weigh enough to overcome gravity and fall to earth as rain.
Aerosols can affect horizontal visibility. Remember Denver, Colorado’s infamous Brown Cloud? While much of it was pollution from auto exhausts, most of it was dust thrown into the atmosphere by wind and auto tires.
Aerosols also affect human health. Fine particles can penetrate deep into lungs. Vision is affected by haze, smog, and reduced contrast. Pollutants have also been linked to respiratory and cardiovascular disease.
Finally, aerosols’ wide-ranging effects are a headache for computer weather models and introduce major uncertainty into weather and climate prediction. Gases set the rules of the atmosphere; aerosols decide how those rules actually play out day to day.
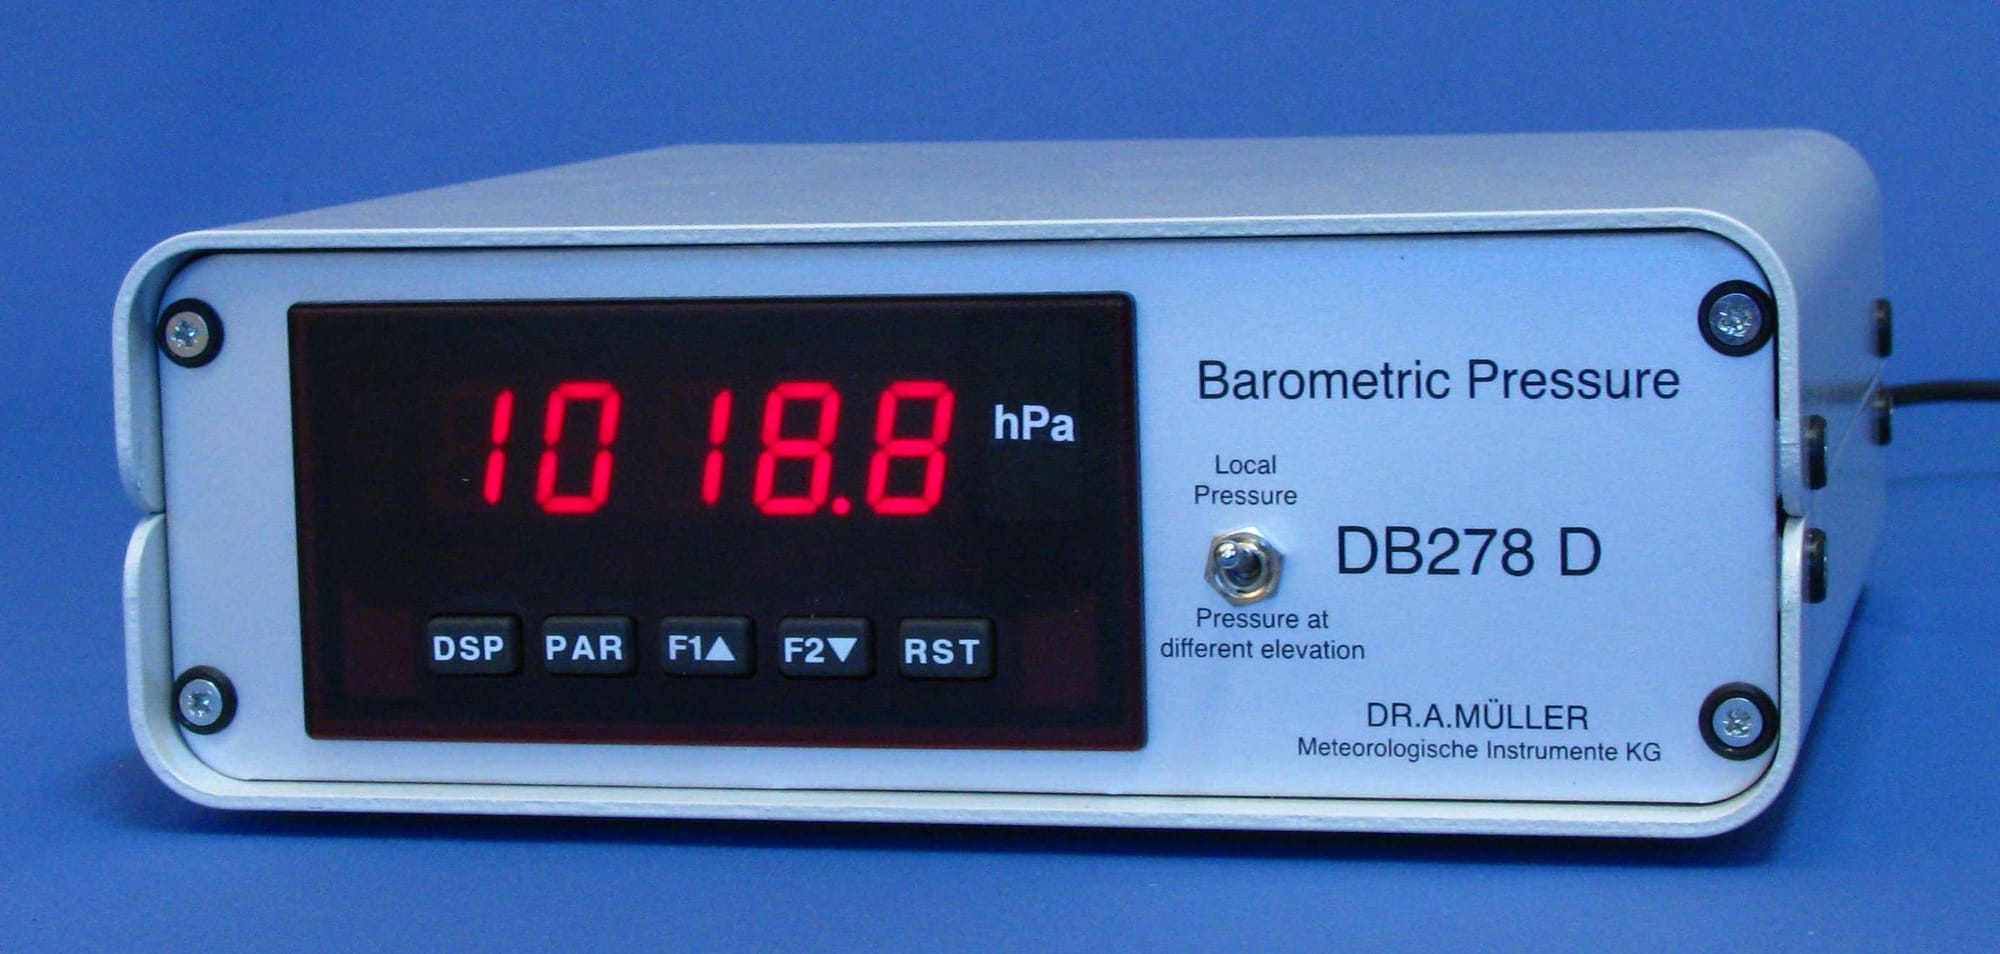
What is Atmospheric Pressure?
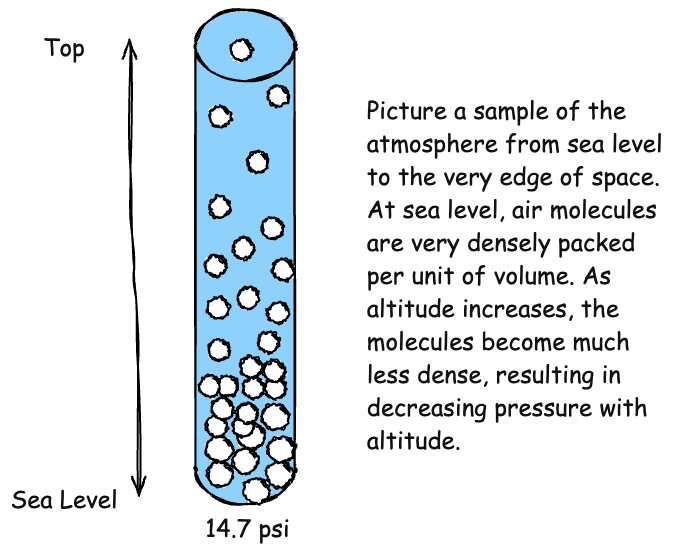
Atmospheric pressure is the weight of the air above a given point on the Earth's surface. It is measured in inches of mercury, millibars (mb), or hectopascals (hPa) (mbs and hPas are used interchangeably), using the square inch in the U.S. as the unit of surface area. On a Standard Day, defined as a pressure of 29.92 inches of mercury or 1013.25 mb/hPa, and 15°C (59°F), the atmosphere weighs 14.696 pounds per square inch. The temperature, 15°C (59°F) is the average temperature on Earth. Known as the International Standard Atmosphere (ISA), these values were developed by the International Civil Aviation Organization (ICAO) for use in aviation, meteorology, and engineering, forming a baseline for atmospheric measurements, which vary widely between locations and elevations.
Pressure decreases with altitude, with half of the atmosphere below 18,000 feet. Pressure also varies with temperature and humidity. All of these factors result in differences in pressure between locations on the Earth's surface, some areas with higher pressure and some with lower. When pressure varies horizontally, air naturally flows from areas of higher pressure to low pressure, creating wind. The greater the difference, the stronger the wind.
How does the atmosphere exert pressure? It is exerted by the motion of all the molecules that compose the atmosphere. This motion is brought about by two forces.
The first is brownian motion. Brownian motion is the random, jittery movement of microscopic particles—such as pollen grains or smoke—suspended in a fluid (liquid or gas), caused by countless collisions with the much smaller, rapidly moving molecules of the fluid. Because fluid molecules are in constant thermal motion, they strike the suspended particle unevenly from all sides, producing a seemingly erratic path that never settles into a straight line. This phenomenon, first observed by botanist Robert Brown in 1827, provided key evidence for the existence of atoms and molecules, and it later became foundational in statistical mechanics for describing diffusion, molecular kinetics, and stochastic processes.
The second force is thermal motion, which is the constant, chaotic movement of atoms and molecules in any substance due to their thermal energy. Even in solids—where particles are tightly bound—they vibrate around fixed positions; in liquids, they jostle and slide past one another; and in gases, they move freely at high speeds. The temperature of a substance is a direct measure of the average kinetic energy of these particles, so as temperature increases, their motion becomes faster and more energetic. Thermal motion underlies many physical processes, including pressure in gases, diffusion, phase changes, and the microscopic collisions that drive phenomena like Brownian motion.
In a sealed container of some unit volume, like a cubic foot, the air inside and outside are equal at 14.7 pounds per square inch at sea level. The molecules within and without are moving at the same speed, applying the same pressure to all surfaces of the container. Apply heat to the inside of the container, however, and the kinetic motion of the molecules within increases. The molecules move faster as the temperature increases. The impacts on the inside surfaces of the container increase, which is felt as an increase in pressure.
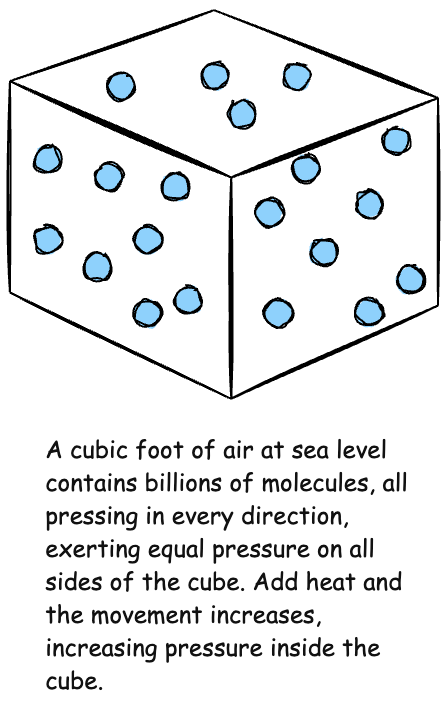
The same thing also happens if, instead of applying heat, the container is simply made uniformly smaller. The molecules within have less space in which to move. They are closer together, which increases the number of collisions. This compression increases the temperature of the air inside the container, which increases the kinetic energy and, thus, the pressure.
On a molecular level, air is mostly space. If air molecules were the size of baseballs, on a Standard Day (59°F) they would be about 0.8-0.9 meters (2.5-3 feet) apart. You could walk between them without touching. Increase the temperature to 80°F, and the molecules are about 1-2% farther apart. That extra space, however, is significant when you consider that water vapor molecules are about 85% smaller than air molecules (think tennis balls). This is why warm air can hold more water vapor than cold air. The water vapor molecules are mixed with the air molecules, so even at 100% relative humidity, the water vapor molecules and the air molecules are still widely spaced. Mixing water vapor molecules with air molecules reduces the mean molecular weight, which is why humid air is less dense than dry air at the same temperature and pressure.
When the sun heats the Earth’s surface, the molecules adjacent to the surface absorb some of that heat and move faster, and this increased movement is felt as heat. If a parcel of air high in the atmosphere is brought down to the Earth’s surface, the higher pressure at the lower altitude compresses the sinking air parcel, warming it. Both of these phenomena are key to Earth’s weather, as will be discussed in leter parts of this series.
We mentioned that air pressure is the accumulated weight of air pressing down on a surface. A square-inch column of air from sea level to the top of the atmosphere presses down with a weight of 14.7 pounds per-square-inch on a Standard Day. If you’re standing atop a 14,000-foot mountain peak, there is less atmosphere above you, less accumulated weight, and therefore less air pressure. If sea level is considered 1000 mb on a Standard Day, the air pressure atop Pikes Peak (14,102’) would be around 595 mb. Less pressure means the air molecules are farther apart, which is perceived as “thinner” air. Because you take in less oxygen per breath, you feel dizzy and fatigued when ascending from sea level to the mountain top.
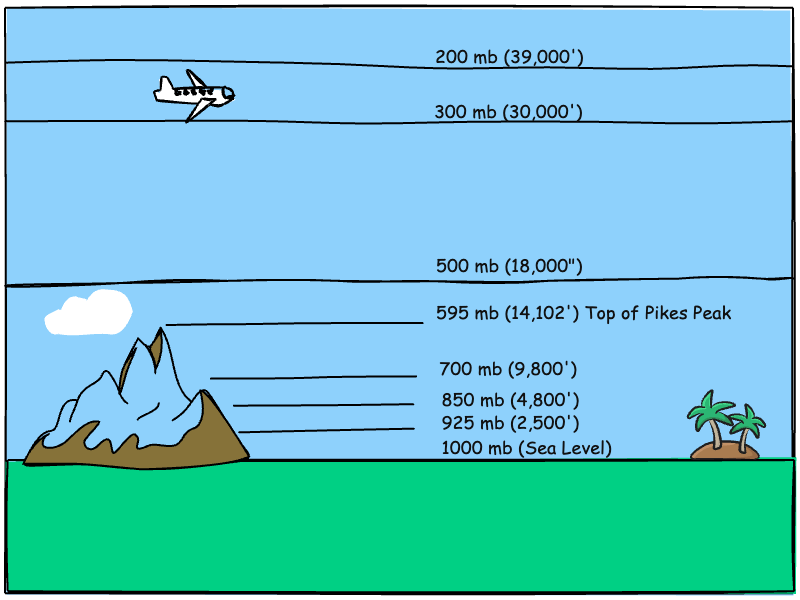
The National Weather service measures pressure, either directly or through computer modeling, at certain standardized pressure levels: sea level (~1000 mb), 925 mb, 850 mb, 700 mb, 500 mb, 300 mb, and 200 mb. The table below shows the altitudes associated with each pressure level.
Approximate Altitude of Common Pressure Levels
|
Pressure Level (mb / hPa) |
Altitude (meters) |
Altitude (kilometers) |
Altitude (feet) |
|
925 mb |
~760 m |
~0.76 km |
~2,500 ft |
|
850 mb |
~1,450 m |
~1.45 km |
~4,800 ft |
|
700 mb |
~3,000 m |
~3.0 km |
~9,800 ft |
|
500 mb |
~5,500 m |
~5.5 km |
~18,000 ft |
|
300 mb |
~9,200 m |
~9.2 km |
~30,000 ft |
|
200 mb |
~11,800–12,000 m |
~11.8–12.0 km |
~39,000 ft |
As mentioned earlier, the 500 mb pressure surface (18,000 feet) marks the halfway point. One half of the atmosphere is below that level. For meteorologists, the 500 mb level is also a starting point when analyzing weather data. The upper level wind maps at 500 mb usually show well-defined high- and low-pressure systems, troughs and ridges, and is high enough minimize influence by the terrain beneath.
The 200 mb level is generally considered the top of the troposphere, the lowest layer of the atmosphere, defined by decreasing temperature and pressure with altitude. Almost all weather occurs within the troposphere, and it is the primary focus of meteorologists. The 300 and 200 mb levels are also where the high-speed jet streams are usually located.
Measuring Air Pressure
Once early investigators realized the atmosphere exerted pressure, the next challenge was to measure it. The first barometers consisted of a glass tube, sealed at one end, mostly filled with water, then upended into a reservoir of water. A one-inch diameter tube would have to be 36 feet in height, allowing for two feet of vacuum space at the top to permit the water to rise or fall with changes in air pressure. The pressure of air against the surface of the reservoir can support a column of water in the tube 33.8 feet high. As atmospheric pressure fluctuates, the top of the water column in the tube moves up and down.

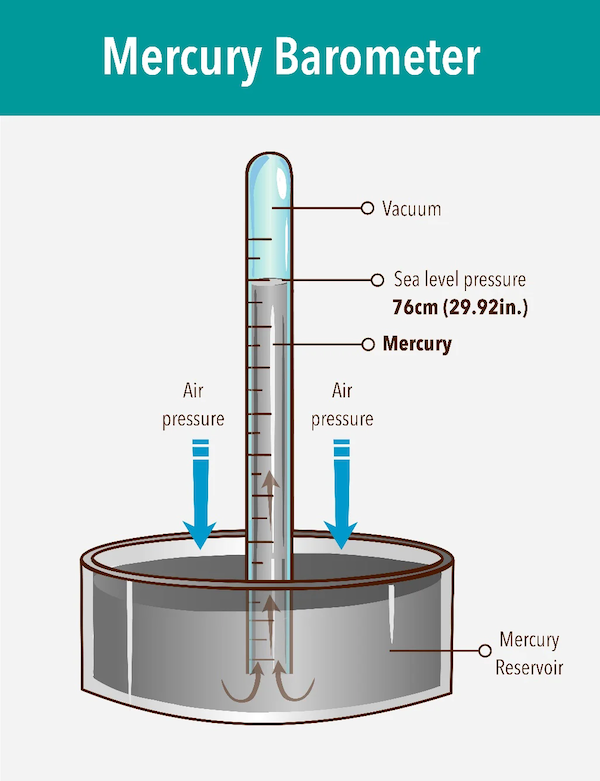
Naturally, a barometer 36 feet high is impractical. In 1643, Torricelli, a student of Galileo, developed a barometer using mercury. Mercury is 13-times denser than water. A gallon of water weighs about 8.3 pounds at room temperature. Mercury, in contrast, weighs 113 pounds. Air pressure can support a column of Mercury in a tube only about 29.92 inches tall, a much more manageable height. For this reason, 29.92 inches of mercury is considered standard pressure on a Standard Day (59°F, 15°C) at sea level.
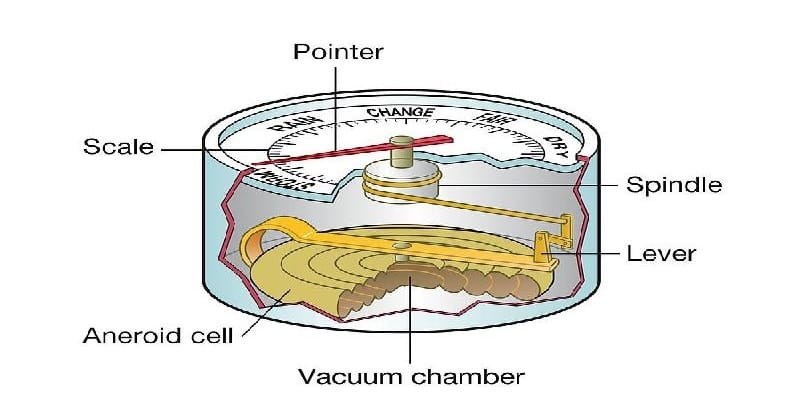
The Torricelli barometer remains the standard for barometric pressure readings, but is impractical for many uses. It has largely been replaced with much smaller aneroid barometers. Inside aneroid barometers is a partially evacuated metal chamber that expands and contracts with variations in air pressure. Attached to an indicator needle through a coiled spring, it provides accurate pressure readings.
For applications that require constant pressure monitoring, such as airports or weather stations, electronic barometers are the standard, providing continuous readouts. Electric barometers convert electrical signals to indications of barometric pressure.
An aircraft altimeter is simply a barometer calibrated in feet. Because pressure changes constantly along the aircraft’s route, the pilots will occasionally enter a new barometric pressure into the altimeter so that all aircraft in the immediate vicinity are using the same calibration. Above 18,000 feet, where local pressure differences are essentially meaningless, all altimeters are required to be set to 29.92” to provide a common reference for the flight levels used at higher altitudes.
Effects of Atmospheric Pressure
Atmospheric pressure is at the heart of many weather phenomena. We’ve already mentioned that air naturally gravitates horizontally from high pressure to low, called advection, creating wind. It also manifests itself in areas you might not realize.
Aircraft Performance
Aircraft performance is very much affected by air density. An astute observer may notice that airports at higher elevations generally have longer runways, depending on the type of aircraft operating from them. Heavy military and civilian aircraft will require longer runways due to their greater takeoff weight. All aircraft, however, require longer runways and longer takeoff rolls at high elevation airports on very hot days.
This is known to aviators as density altitude. Aircraft at high elevation airports on hot days will perform as if the airport were actually at a much higher elevation. Aircraft at an airport like Colorado Springs, at 6,100 feet, may perform as though the airport were at 9,000 feet at certain temperature and pressure conditions. For a more thorough discussion of density altitude, see our article Catching Your Breath.
Multi-engine aircraft used in military and airline applications must meet performance requirements that allow them to safely continue a takeoff in the event of an engine failure during the takeoff roll. Meeting this requirement demands either a very long runway or a decrease in takeoff weight until the requirement is met. At high-elevation airports on hot days, this may mean leaving cargo, baggage, or even passengers behind, known as a weight-restricted flight. If the runway is relatively short, the flight may be runway limited, also requiring a reduction in weight.
Human Physiology
Not only are aircraft affected by low atmospheric pressure. We humans are, too. Anyone who has traveled from sea level to a high elevation city like Denver, Colorado, has likely felt the effects of the elevation change…shortness of breath, fatigue, headache, difficulty sleeping, and lack of energy. This, too, is an effect of density altitude.
Humans take air into the lungs when the diaphram below the lungs moves downward and intercostal muscles expand the rib cage. This increases the volume available to the lungs while decreasing the pressure within relative to the surrounding atmosphere. Higher pressure air outside rushes in through the nostrils or the mouth to fill the space and equalize the pressure. When the diaphram relaxes, the volume available to the lungs decreases, the pressure within the lungs increases, and air is expelled. The breathing reflex kicks in again and the cycle begins anew.
The lungs are filled with alvioi and surrounded by capillary beds. Alvioli are tiny sacs, very thin-walled (~0.5 microns), moist, and highly vascularized, i.e. wrapped in capillaries. This design maximizes diffusion. Diffusion is extremely fast—0.25 seconds for equlibrium in a healthy lung. The process is not 100% efficient; fresh air mixes with stale air, but never fully replaces it.
When the lungs fill, differential air pressure helps oxygen diffuse across the membrane into the alvioli, while CO2 diffuses outward to be expelled during exhale. The oxygen then further diffuses into the capillaries, where it is absorbed into the blood for distribution throughout the body. Nitrogen is also taken in during inhalation, but is expelled during exhalation. Nitrogen used by the body is taken in through food.
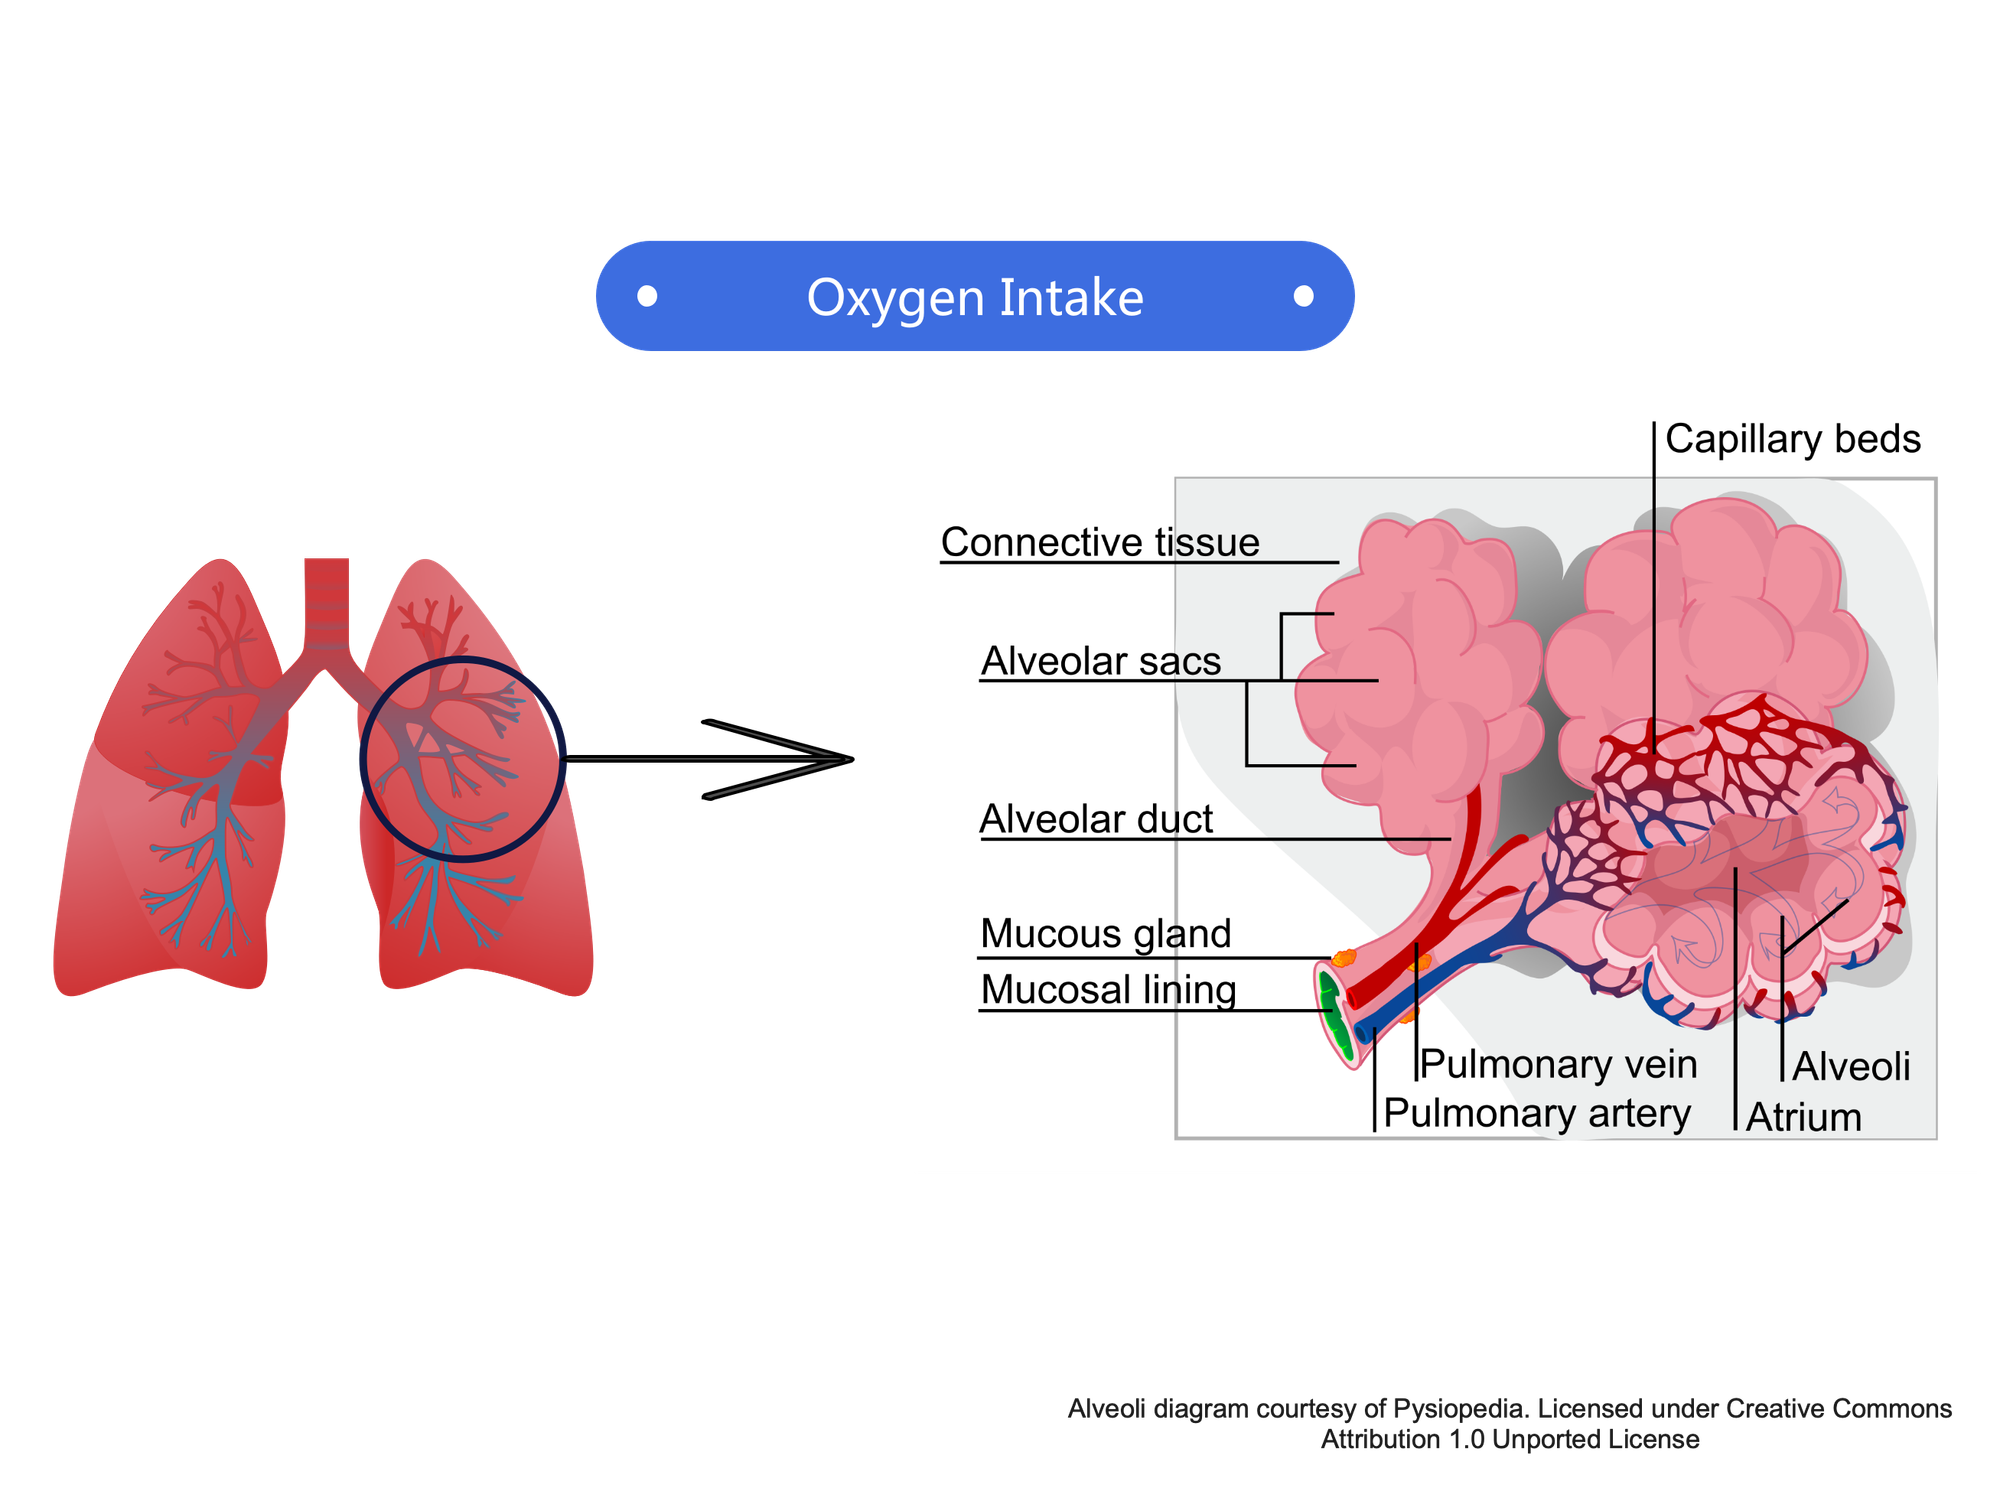
Human lungs contain about 480 million alveoli, providing about 70-100 m² of gas exchange area—around the size of a tennis court. This design maximizes diffusion. Diffusion is extremely fast—0.25 seconds for equlibrium in a healthy lung. The process is not 100% efficient; fresh air mixes with stale air, but never fully replaces it.
Moving from a lower to a much higher elevation exposes a person to lower vapor pressures, meaning diffusion across membranes is less efficient due to lower partial pressures, and less oxygen is absorbed by the alvioli for distribution by the blood stream. If a person moves to a high elevation for an extended period of time— weeks, months, or permanently—adaptation takes place. The lungs develop more alvioli, allowing absorption of greater amounts of oxygen. This acclimatization process can take weeks or months, depending on the person’s age and physical condition.
In Part 2, we'll examine how atmospheric circulation works on a planet that, like our moon, always shows the same face toward the sun. It's a hot topic.