Exploring the Weather Prediction Center's website
The WPC's web site offers a glimpse into cutting-edge and experimental weather forecasting tools.

One of the most interesting websites under NOAA’s National Weather Service umbrella is the Weather Prediction Center. The WPC describes itself as:
“America’s Go-To Center for high-impact precipitation events and forecast guidance out to 14 days….”
Some of the WPS’s primary functions are described as:
- Quantitative Precipitation Forecasts (QPF)–this desk prepares and issues forecasts of accumulating (quantitative) precipitation, heavy rain, and heavy snow, and highlights areas for flash flooding;
- Mesoscale Precipitation Discussions—discussion and graphic showing areas where WPC forecasters expect conditions to occur that may cause flash flooding over the next 6 hours;
- Winter Weather Forecasts—the Winter Weather Desk issues heavy snow and icing operations products. These are routinely issued from September 15 to May 15;
- Short-Term Forecasts—the short-range forecasters are responsible for preparing forecasts for the period of 6 through 60 hours. These products are issued twice daily using guidance from the NWS’s Global Forecast System (GFS) and North American Mesoscale model (NAM), as well as guidance from the European Centre for Medium Range Weather Forecasts (ECMWF), the United Kingdom’s Meteorology Office (UKMET), the Meteorological Service of Canada, including ensembles;
- Medium-Range (days 3-7) Public Forecasts;
- Surface analysis—focused on synoptic (large scale) and mesoscale features over North America north of 31°N.
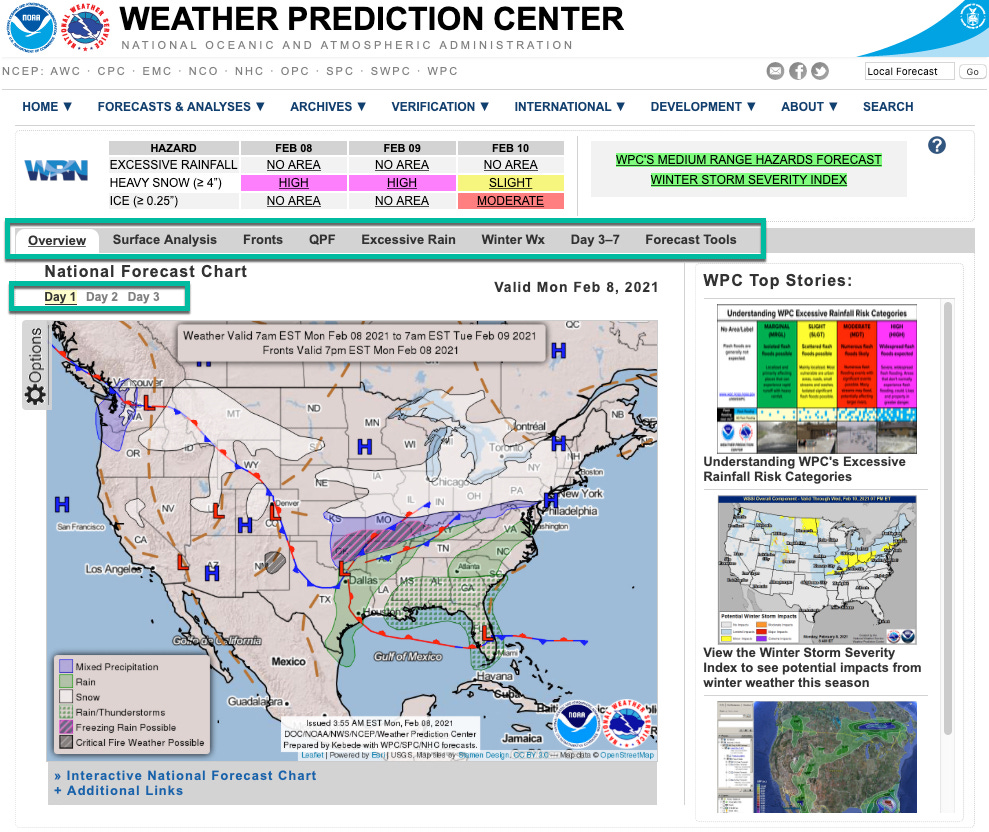
Upon landing on the Weather Prediction Center’s home page (Fig. 1), you will be presented with a blizzard (sorry) of information, graphics, and links to many WPC products. The graphic near the top of the page catches the eye. Note the tabs just above the graphic that allow you to choose different graphics for the various products. Below the tab is the Day selection menu.
The first graphic tab, selected by default, is the Overview tab. This graphic gives a comprehensive view of expected weather conditions for three days. By mousing over Day 1, Day 2, and Day 3 the graphic will update with expected conditions for each of the next three days. A boxed callout at the top of the graphic will give you the valid times for the forecast.
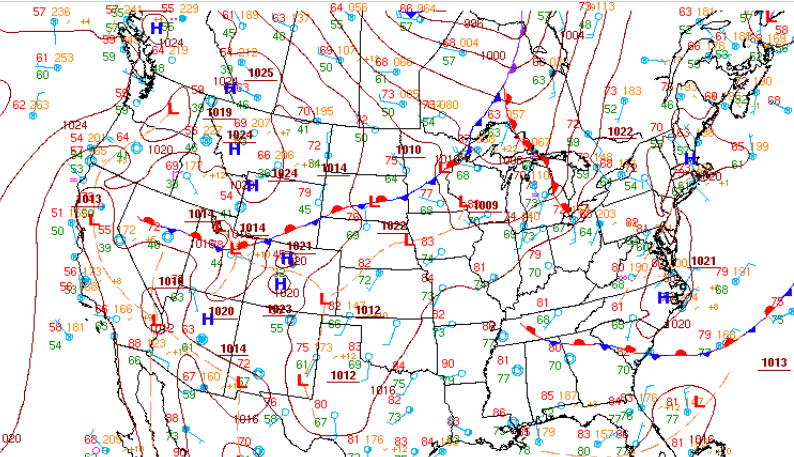
The Surface Analysis Tab will show the surface analysis chart (Fig. 2, above) with the locations of fronts, high and low-pressure centers, wind direction arrows, temperatures, and pressure isobars. The graphic defaults to the latest surface analysis, but a 24-hour look-back is provided by mousing over the menu immediately above the graphic.
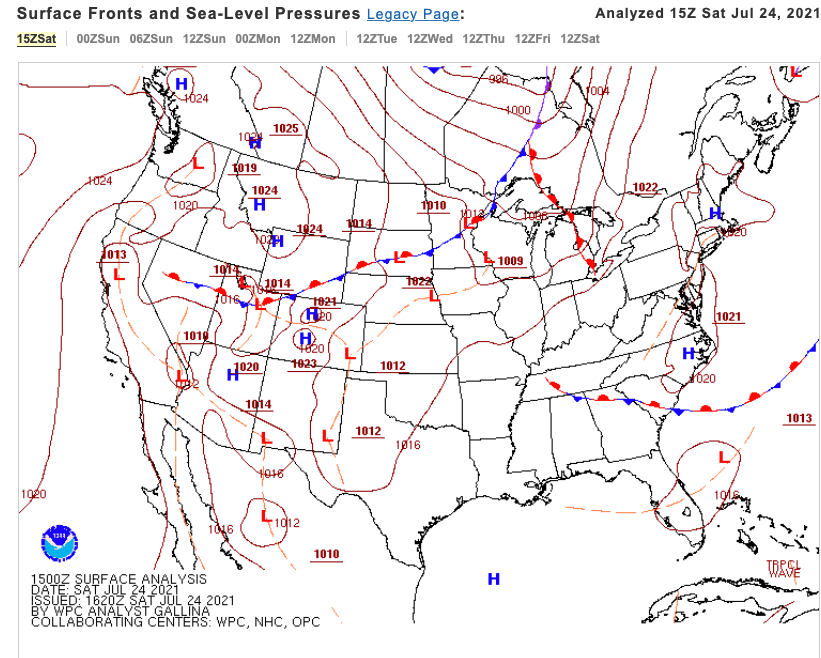
The Fronts tab presents the same surface analysis chart without the wind and temperature information (Fig. 3). It’s a cleaner surface analysis chart that allows you to quickly locate fronts and pressure centers, along with isobars. Mousing over the menu above the graphic allows you to look ahead at predicted frontal positions and associated precipitation predictions in six-hour and 12-hour intervals for the next seven days.
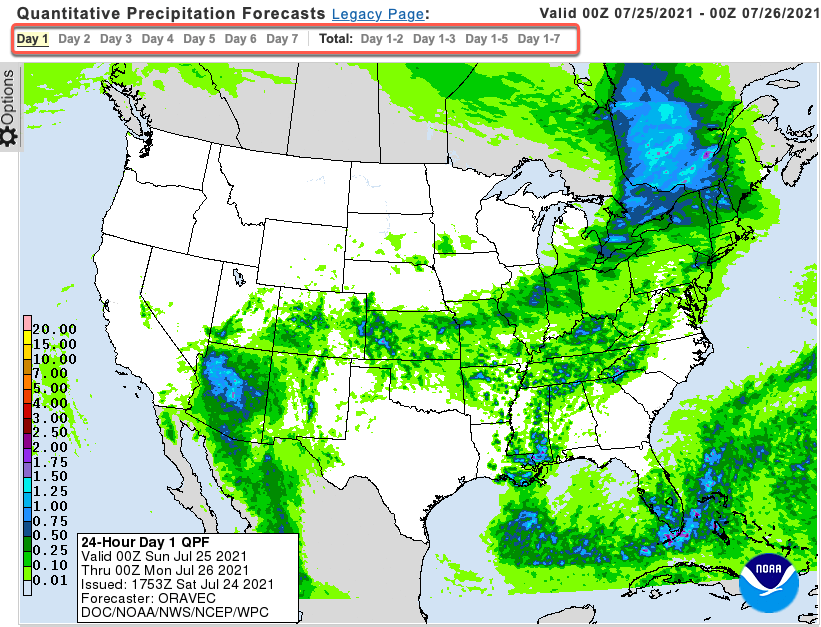
The graphic (Fig.4) on the QPF (Quantitative Precipitation Forecasts) tab shows the location and expected intensities of forecast precipitation. Mousing over the menu above the graphic offers a one-week look-ahead. The Total menu shows accumulated precipitation totals for the indicated intervals.
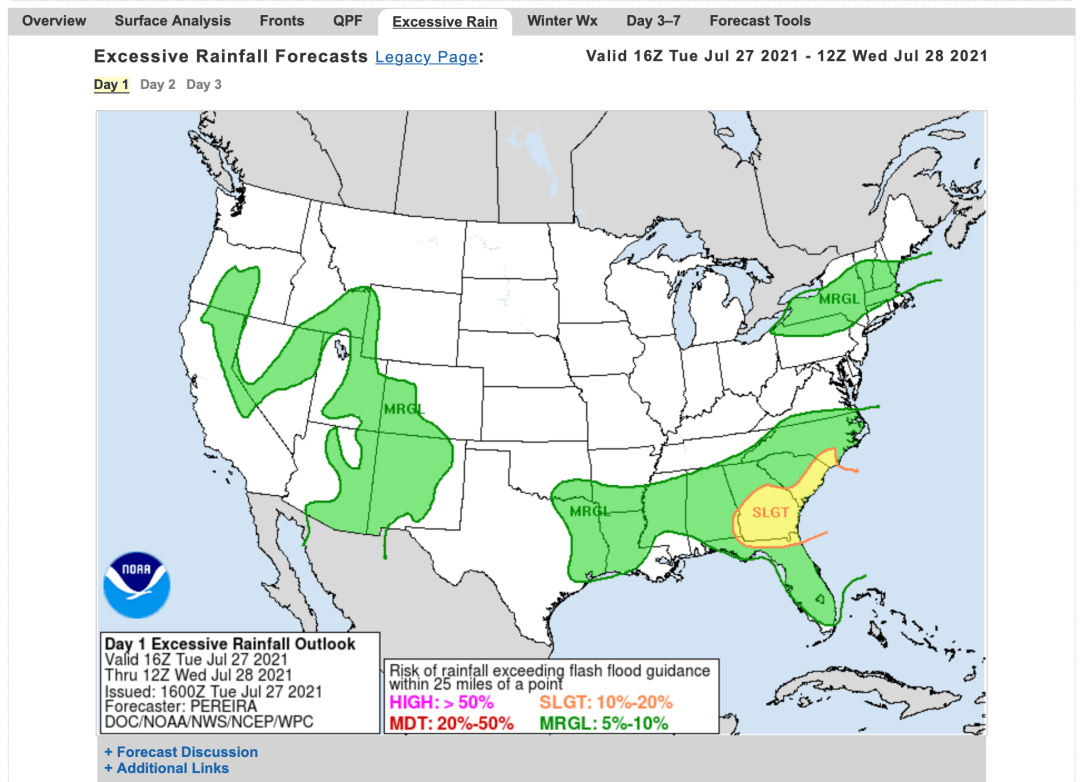
The Excessive Rain tab (Fig. 5, below) is the prediction that rainfall will exceed flash flood guidance, i.e. the probability of rainfall high enough to cause flash flooding. Mousing over the menu above the graphic gives a 3-day look-ahead. As seen in this graphic, the southwest and southeastern US have probabilities ranging from slight to marginal.
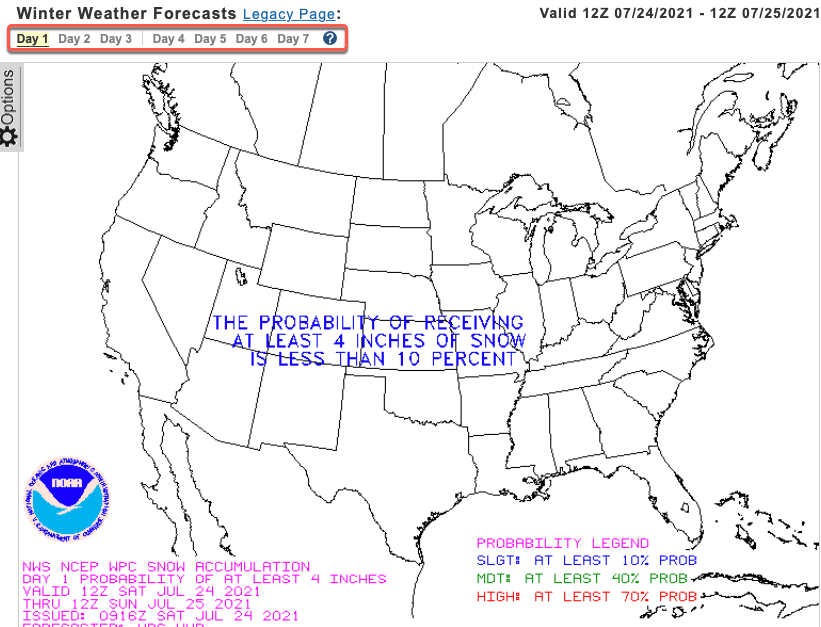
The Winter Weather tab shows the probability of winter weather exceeding 0.25 inch of the liquid equivalent of snow or sleet. Again, mousing over the menu gives a 7-day look-ahead. Needless to say, this graphic (Fig. 6) from July 2021 shows little probability of winter weather.
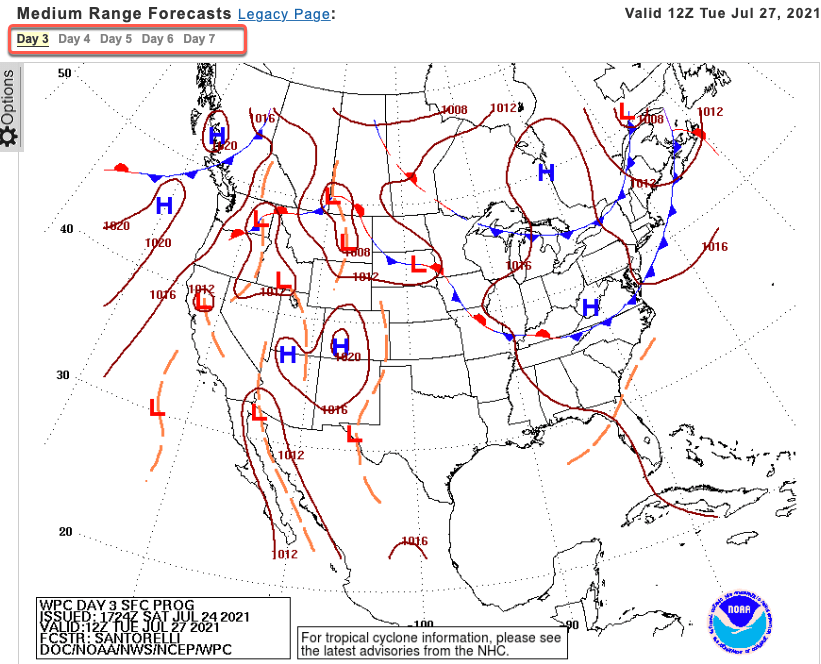
The Day 3-7 tab (Fig. 7) is a five-day look-ahead at forecast positions of fronts and pressure centers. It is similar to the Fronts tab graphic, but consists of just the medium-range forecast. Mousing over the menu will step through the predicted movements of the weather systems.
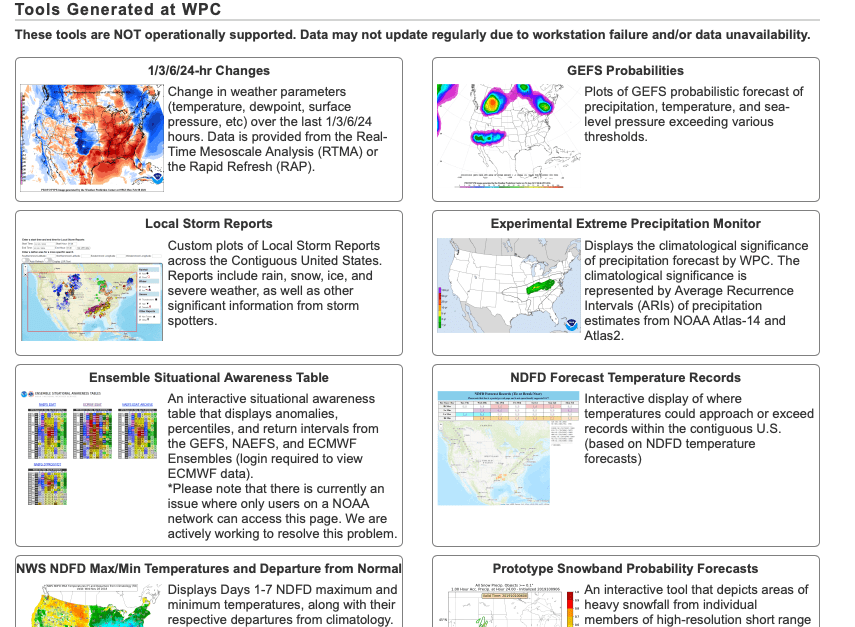
The final tab, Forecast Tools (Fig. 8), contains links to predictive tools used by NWS meteorologists when assembling their local forecasts. Like much of the quantitative data on the Weather Prediction Center’s website, a notice at the top of the page warns that the information is a prototype and may not update regularly.
In fact, for those who read their local Forecast Office’s forecast discussion on their web page, it’s quite common to find mention of adjustments and alterations to their forecast that modify the WPC’s data. This is a prime example of local knowledge overriding weather models. Local meteorologists, who have seen how terrain, microclimates, and other factors can modify weather systems, often make adjustments to the data if they think the WPC is forecasting, for instance, too much snow or rain or not enough.
While intended for use by professional meteorologists, the WPC data and charts are available to the public and may be of interest to those of us who love the weather and enjoy measuring and making our own predictions. I’ve only touched on the home page of the WPC website. Take some time to explore the different links and you’ll begin to uncover the wealth of data available.
You may access the Weather Prediction Center's website here.